
Best experienced using the browsers chrome Firefox
 Safari
 IE version (9,10,11)
PHISDetector
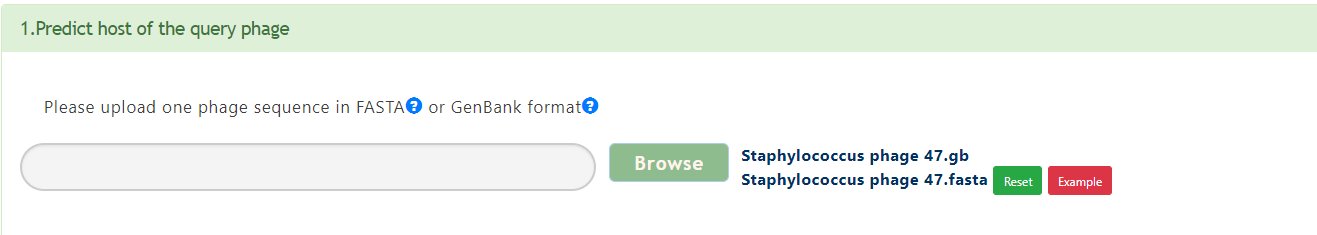
PHISDetector receives bacterial or viral genomic sequences in GenBank or (multi-)FASTA format as input and provides well-designed visualizations and detailed data tables to download. The PHISDetector webserver supports three kind of analysis:
1) Evaluate interacting probability for a pair of phage and bacterial genome.
2) Predict the infecting phages for a query bacterial genome.
3) Predict the bacterial hosts for a query phage genome.
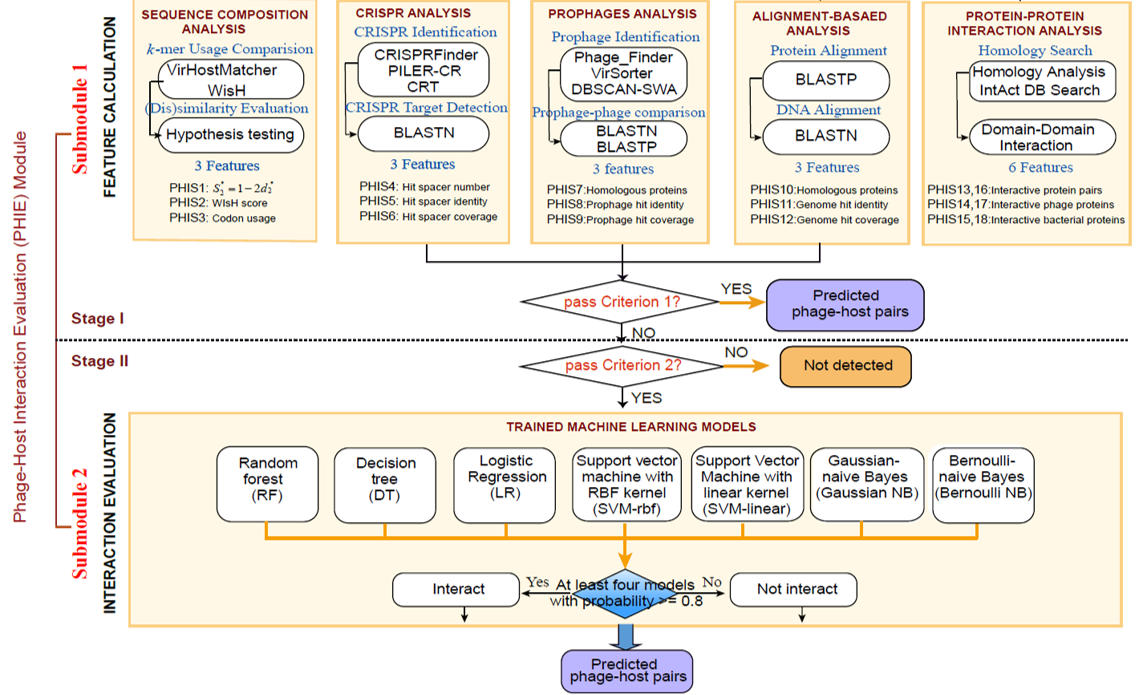
If a pair of bacteria-phage genome sequences have been submitted, diverse in silico phage-host interaction signals(PHISs) (18 features) including CRISPR, Prophage, Genetic homology, Sequence composition and Protein-Protein interactions(PPI) will be detected and calculated to characterize the interaction using PHIE module. Finally, a consensus analysis is performed to indicate the possible integrity of the predicted interactions.

PHIE is a analysis module to evaluate the interaction between a bacterium-phage sequence pair in terms of CRISPR, Prophage, Genetic homology, Sequence composition and Protein-Protein Interaction. Using Criterion 1 and Criterion 2, PHIE evaluates this interaction through 18 PHIS features based on above five PHISs and trains machine learning models. Furthermore, Phage Genome and Protein Database (PGPD) and Bacterial Genome and Protein Database (BGPD) has been created for follow-up analysis.
Output[link to result]
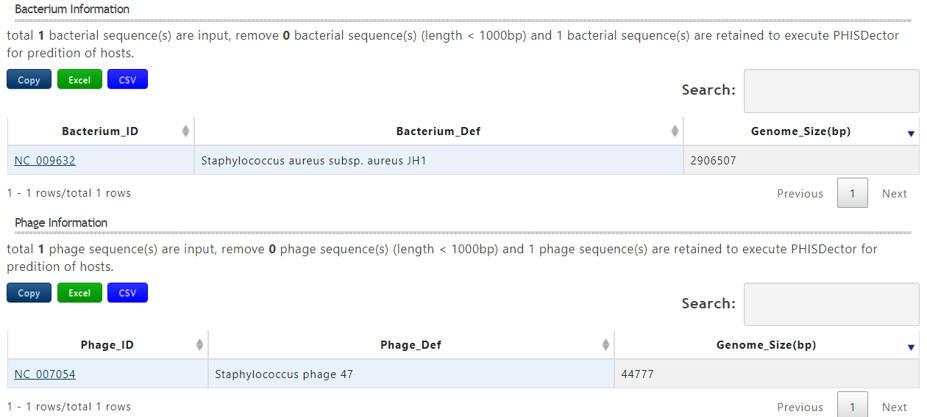
A table contains the detailed information of query bacterium and the description is shown in the following:
| Header | Description |
|---|---|
| Bacterium_ID | The accession number of query bacterium |
| Bacterium_Def | The definition information of query bacterium |
| Genome_Size(bp) | The genome length of the query bacterium |
A table contains the detailed information of query phage and the description is shown in the following:
| Header | Description |
|---|---|
| Phage_ID | The accession number of query phage |
| Phage_Def | The definition information of query phage |
| Genome_Size(bp) | The genome length of the query phage |
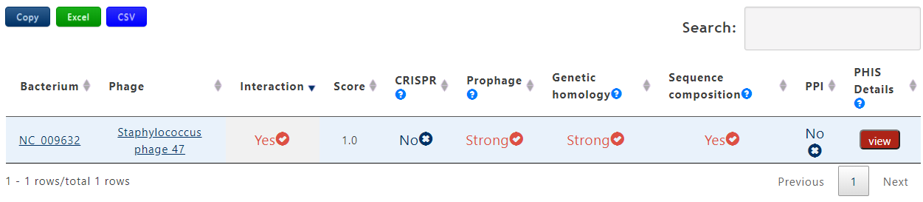
A table contains the detailed information of query phage-host interaction and the description is shown in the following:
| Header | Description |
|---|---|
| Bacterium | The accession number of query bacterium |
| Phage | The definition information of query bacteriophage |
| Score | The average probablity of the interaction calculated by 7 trained machine learning models. If the the bacterium-phage pair passes PHIS Criterion 1, the score will be assigned 1 |
| CRISPR | Strong, Weak or No. Strong denotes that the bacterium-phage pair passes Criterion 1 in CRISPR, Weak denotes that the bacterium-phage pair passes Criterion 2 in CRISPR but not for Criterion 1 and No means that the bacterium-phage pair fails to pass any Criterion |
| Prophage | Strong, Weak or No. Strong denotes that the bacterium-phage pair passes Criterion 1 in Prophage, Weak denotes that the bacterium-phage pair passes Criterion 2 in Prophage but not for Criterion 1 and No means that the bacterium-phage pair fails to pass any Criterion |
| Genetic homology | Strong, Weak or No. Strong denotes that the bacterium-phage pair passes Criterion 1 in Genetic homology, Weak denotes that the bacterium-phage pair passes Criterion 2 in Genetic homology but not for Criterion 1 and No means that the bacterium-phage pair fails to pass any Criterion |
| Sequence composition | Yes or No. Yes denotes that the bacterium-phage pair passes PHIS Criterion in Sequence composition and No means the reverse. |
| PPI | Yes or No. Yes denotes that the bacterium-phage pair passes PHIS Criterion in PPI and No means the reverse. |
| PHIS Details | Click the view button to get the result page of PHIE between the phage-host pair |
PHIE module results
CRISPR Analysis
418,766 spacer sequences were predicted with CRT[29], CRISPRFinder[6] or PILER-CR[7] from 69,880 bacterial sequences and used to build CRISPR Spacer Database (CSD). 1) If a phage genome is submitted, PHISDetector will detect spacer hits based on CSD by BLASTN and the hit bacterial sequences will be sent to PHIE module for follow-up analysis. 2) If a bacterial genome is submitted, CRISPR arrays will be identified on the bacterial genome and spacer hits will be detected based on PGPD by BLASTN. The hit phages will be sent to PHIE module for follow-up analysis 3) If a bacterium-phage pair is submitted, CRISPR arrays will be identified on the bacterial genome and spacer hits will be detected between the bacterium-phage pair by BLASTN, and sent to PHIE module for follow-up analysis.
Output[link to result]
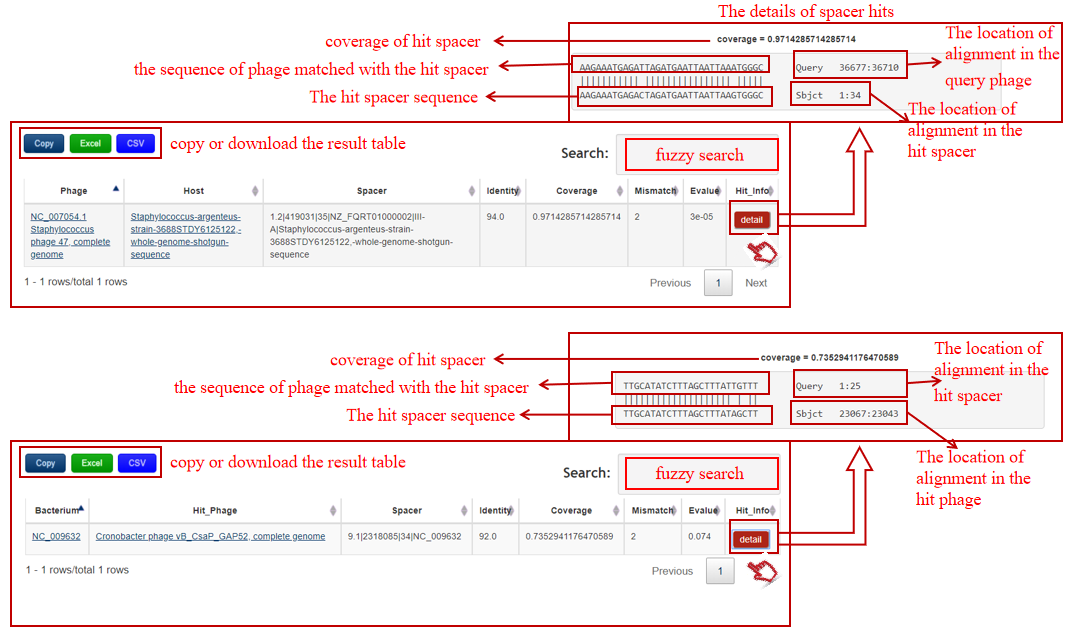
A table contains the detailed information of spacer hits between the bacterium-phage pair and the description is shown in the following:
| Header | Description |
|---|---|
| Phage | The definition information of query phage(if phage sequence is submitted) that links to NCBI if deposited in NCBI |
| Host | The definition information of predicted host that links to NCBI if deposited in NCBI |
| Bacterium | The accession number of query bacterium(if bacterial sequence is submitted) that links to NCBI if deposited in NCBI |
| Hit_Phage | The definition information of hit bacteriophage that links to NCBI if deposited in NCBI |
| Spacer | The accession number of the hit spacer in bacterial genome, defined by in-house program:CRISPR ID.spacer index|spacer start|spacer length|bacterial ID(|bacterial information) |
| Identity | The identity value of the spacer hit between the bacterium-phage pair by BLASTN |
| Coverage | The coverage value of the hit spacer matched with the phage by BLASTN |
| Mismatch | The number of mismatch of the spacer hit |
| Evalue | E-value of the spacer hit |
| Hit_Info | The detailed information of the spacer hit |
Prophage Analysis
Prophage DNA and Protein Database (PDPD) was built for prophage analysis and composed of Prophage DNA database contained DNA sequences of 63,352 prophage regions identified in 9,646 bacterial genomes using Phage_Finder or DBSCAN-SWA (our in-house developed prophage detection tool) and Prophage protein database contained 345,086 protein sequences predicted using FragGeneScan on these prophage regions. 1) If a phage genome is submitted, PHISDetector will detect prophage hits based on PDPD by BLASTP and BLASTN and the hit bacterial sequences will be sent to PHIE module for follow-up analysis. 2) If a bacterial genome is submitted, prophage regions will be identified on the bacterial genome and prophage hits will be detected based on PGPD by BLASTP and BLASTN. The hit phages will be sent to PHIE module for follow-up analysis 3) If a bacterium-phage pair is submitted, prophage regions will be identified on the bacterial genome and prophage hits will be detected between the bacterium-phage pair by BLASTP and BLASTN, sent to PHIE module for follow-up analysis.
Output[link to result]
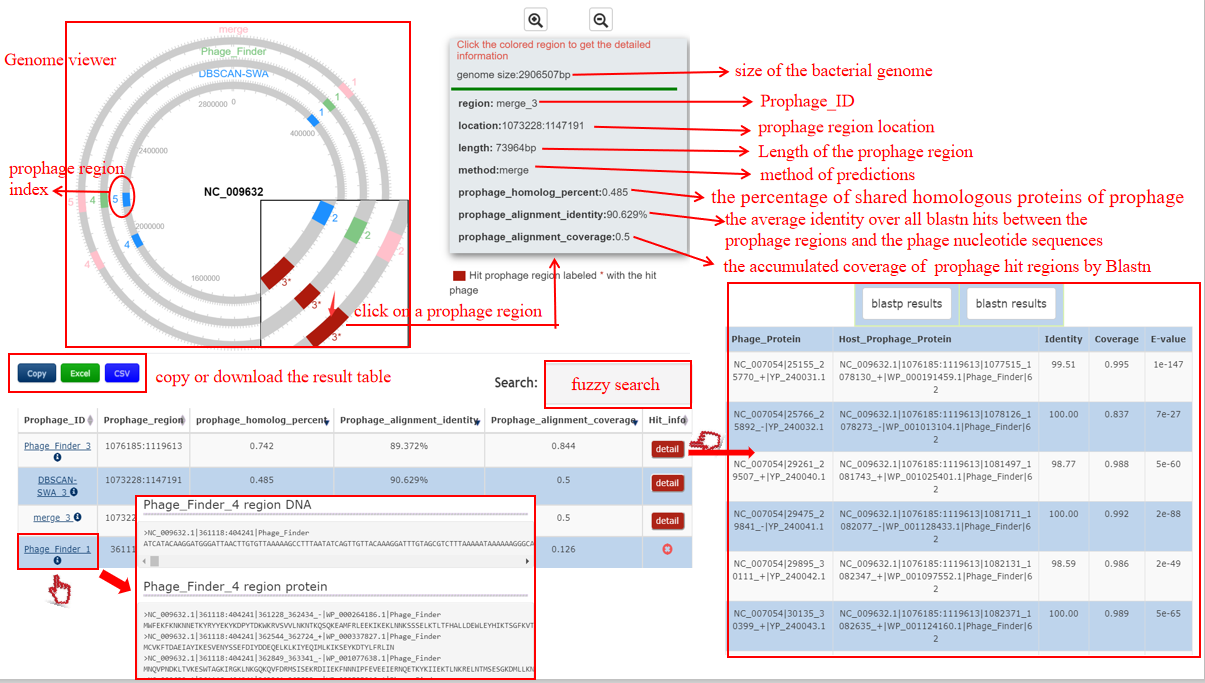
A table contains the detailed information of prophage hits between the bacterium-phage pair and the description is shown in the following:
| Header | Description |
|---|---|
| Prophage_ID | Detection method + the number assigned to the prophage region, e.g. DBSCAN-SWA_1. Click to get the nucleotide and protein sequences of the prophage region |
| Prophage_region | The location of the prophage region |
| Prophage_homology_percent | The percent of prophage proteins homology with the phage proteins by Diamond BLASTP |
| Prophage_alignment_identity | The average identity over all the hits between the prophage region and the phage by BLASTN |
| Prophage_alignment_coverage | The accumulated coverage of the prophage region over all the hits between the prophage region and the phage by BLASTN |
| Hit_info | Click detail button to get the detailed information of homology proteins and exact matches between each prophage region and the phage by Diamond BLASTP and BLASTN if the bacterium-phage pair passes Criteria 2. |
A table contains the detailed information of homology proteins between the bacterium-phage pair and the description is shown in the following:
| Header | Description |
|---|---|
| Phage_Protein | Phage ID|protein location|protein accession number in NCBI |
| Host_Prophage_Protein | Bacterium ID|prophage location|protein loction|protein accession number in NCBI|detection method|protein number of the prophage region |
| Identity | The identity value between the bacterium-phage proteins pair |
| Coverage | The coverage of the hit prophage protein homology with the phage protein |
| E-value | The E-value of this homology alignment |
A table contains the detailed information of alignment between the bacterium-phage pair by BLASTN and the description is shown in the following:
| Header | Description |
|---|---|
| Hit_Prophage_Region | Prophage ID|location of the hit region in the prophage |
| Hit_Phage_Region | phage ID|location of the hit region in the phage |
| Alignment Length | The length of the hit region |
| Identity | The identity value between the hit region in the prophage and the hit phage region |
| E-value | The E-value of this alignment |
Genetic homology
Genetic homology(BLASTP and BLASTN) detect the exact matches between the bacterium-phage pair regions of genetic homology. 1) If a phage genome is submitted, PHISDetector will predict the candidate hosts based on BGPD by BLASTP and BLASTN and the hit bacterial sequences will be sent to PHIE module for follow-up analysis. 2) If a bacterial genome is submitted, PHISDetector will predict the infecting phages based on PGPD by BLASTP and BLASTN. The hit phages will be sent to PHIE module for follow-up analysis 3) If a bacterium-phage pair is submitted, PHISDetector will excute homology seacrh and nucleotide alignment by BLASTP and BLASTN and be sent to PHIE module for follow-up analysis.
Output[link to result]
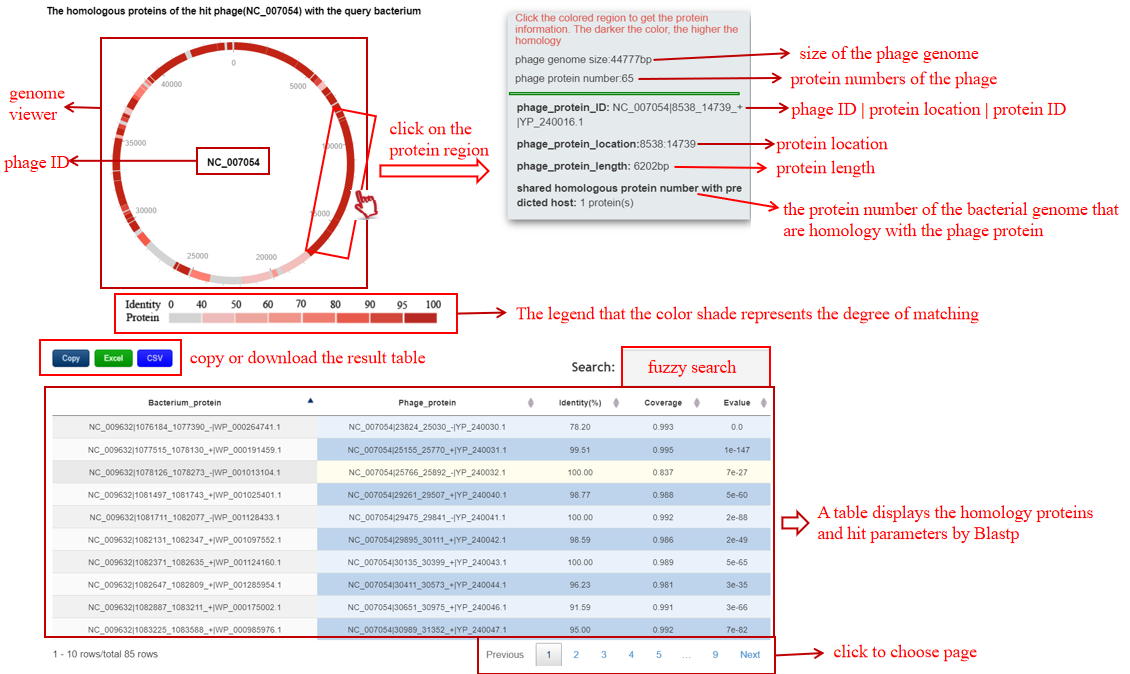
A table contains the detailed information of exact matches by BLASTP between the bacterium-phage pair and the description is shown in the following:
| Header | Description |
|---|---|
| Bacterium_protein | Bacterium ID|protein location|protein ID in NCBI or Bacterium ID_protein location |
| Phage_protein | phage ID|protein location|protein ID in NCBI or phage ID_protein location |
| Identity(%) | The identity value between the bacterium-phage proteins pair |
| Coverage | The coverage of the hit phage protein homology with the bacterial protein |
| Evalue | The E-value of this homology alignment |
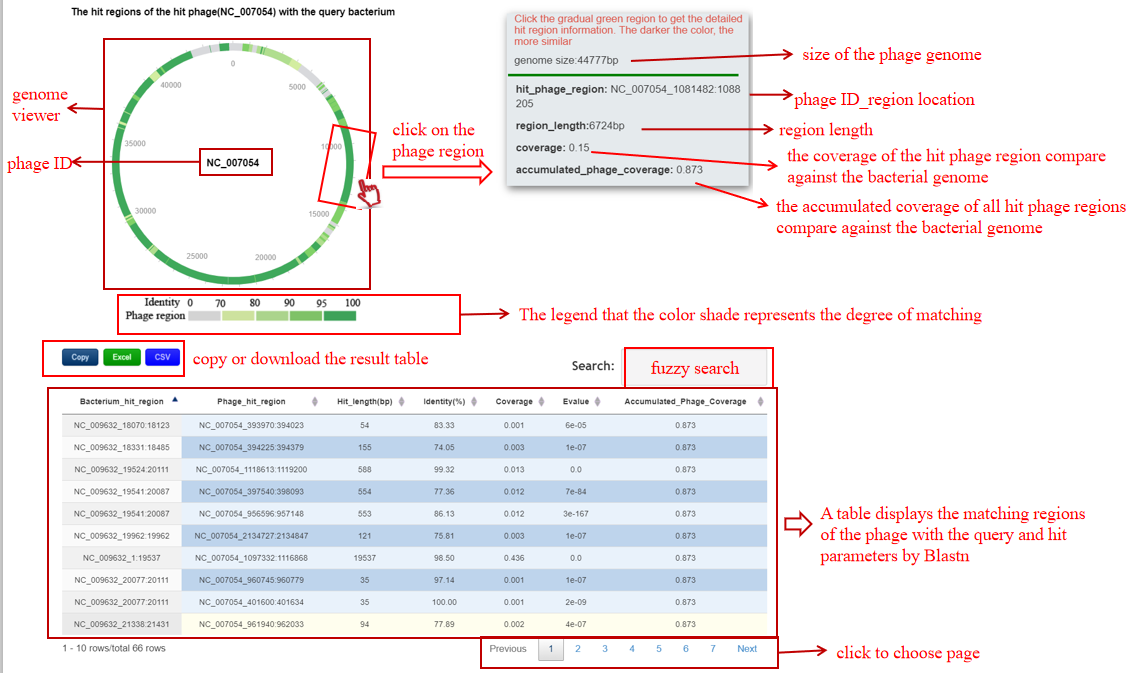
A table contains the detailed information of alignment between the bacterium-phage pair by BLASTN and the description is shown in the following:
| Header | Description |
|---|---|
| Bacterium_hit_region | bacterium ID|location of the hit region in the bacterium |
| Phage_hit_region | phage ID_location of the hit region in the phage |
| Hit_length(bp) | The length of the hit region |
| Identity(%) | The identity value between the hit region in the bacterium and the hit phage region |
| Coverage | The coverage of the hit region in the phage |
| Evalue | The E-value of this alignment |
| Accumulated_Phage_Coverage | The accumulated coverage of the hit regions over all the hits in the phage |
Sequence composition
Sequence Composition Database (SCD) contained k-mer (k=6) frequency and codon usage calculated for BGPD and PGPD, and Homogeneous Markov Models trained for BGPD using WIsH method. Sequence composition detect the sequence composition similarity between the bacterium-phage pair in terms of S2* score, WIsH score and Codon Usage score. 1) If a phage genome is submitted, PHISDetector will calculate sequence composition related feature values between the phage and all the candidate hosts filter by CRISPR, Prophage and Genetic homology using Criterias based on SCD and the hit bacterial sequences will be sent to PHIE module for follow-up analysis. 2) If a bacterial genome is submitted, PHISDetector will calculate sequence composition related feature values between the phage and all the candidate infecting phages filtered by CRISPR, Prophage and Genetic homology using Criterias based on SCD. The hit phages and the query bacterium will be sent to PHIE module for follow-up analysis 3) If a bacterium-phage pair is submitted, PHISDetector will calculate sequence composition related feature values between this pair and be sent to PHIE module for follow-up analysis.
Output[link to result]
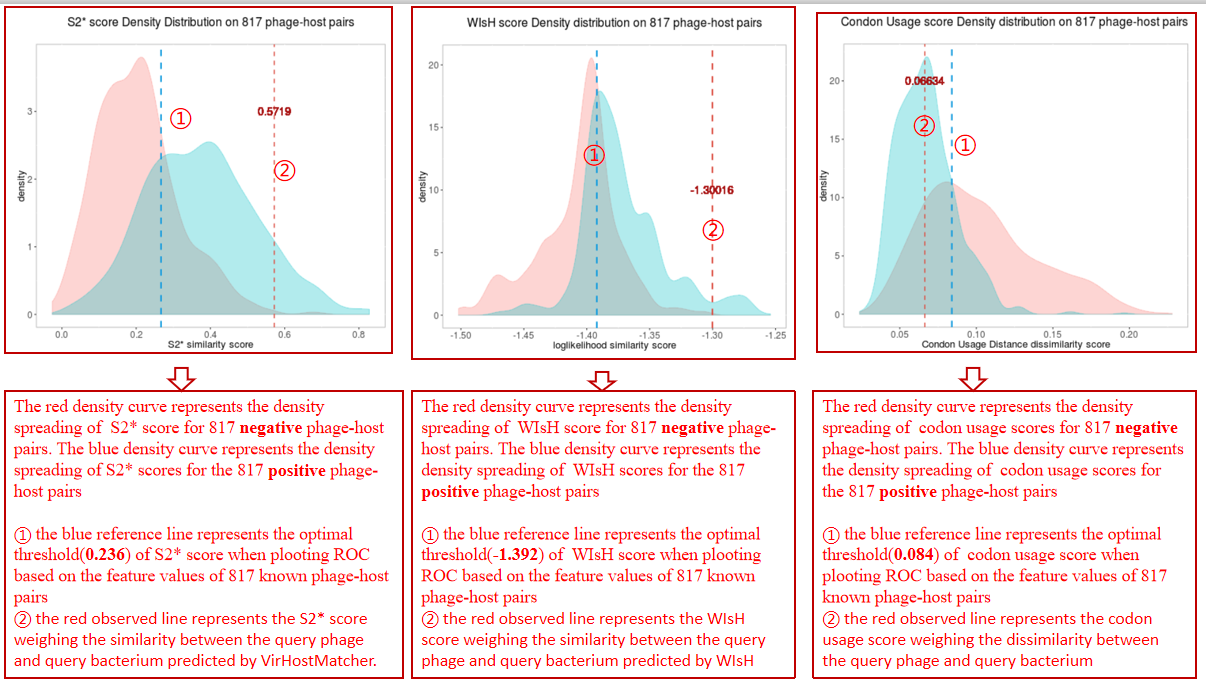
A table contains the detailed information of S2* score calculated between the bacterium-phage pair and the description is shown in the following:
| Header | Description |
|---|---|
| Bacterium | Bacterium ID|protein location|protein ID in NCBI or Bacterium ID_protein location |
| Phage | phage ID|protein location|protein ID in NCBI or phage ID_protein location |
| S2* score | The average S2* score calculated between the phage and all the hit contigs of the bacterium by VirHostMatcher[3] |
| WIsH score | The average WIsH score calculated between the phage and all the hit contigs of the bacterium by WIsH[4] |
| Codon Usage score | The average Codon Usage score calculated between the phage and all the hit contigs of the bacterium |
Protein-Protein Ineraction(PPI)
912 non-redundant PPIs and 318 non-redundant Pfam domain-domain interactions (DDIs) were remained and considered to be correlated with phage-host interactions and used to build Protein-Protein Interaction (PPI) Database (PPID) for further evaluating phage-host interactions. More details can be seen in download Protein-protein Interaction 1) If a phage genome is submitted, PHISDetector will detect PPIs based on homology search and DDIs based on domain annotation with hmmscan in the PPID between the phage and all the candidate hosts filter by CRISPR, Prophage and Genetic homology using Criterias and the hit bacterial sequences will be sent to PHIE module for follow-up analysis. 2) If a bacterial genome is submitted, PHISDetector will detect PPIs based on homology search and DDIs based on domain annotation with hmmscan in the PPID between the phage and all the candidate infecting phages filtered by CRISPR, Prophage and Genetic homology using Criterias. The hit phages and the query bacterium will be sent to PHIE module for follow-up analysis 3) If a bacterium-phage pair is submitted, PHISDetector will directly detect PPIs based on homology search and DDIs based on domain annotation with hmmscan between this pair and be sent to PHIE module for follow-up analysis.
Output[link to result]
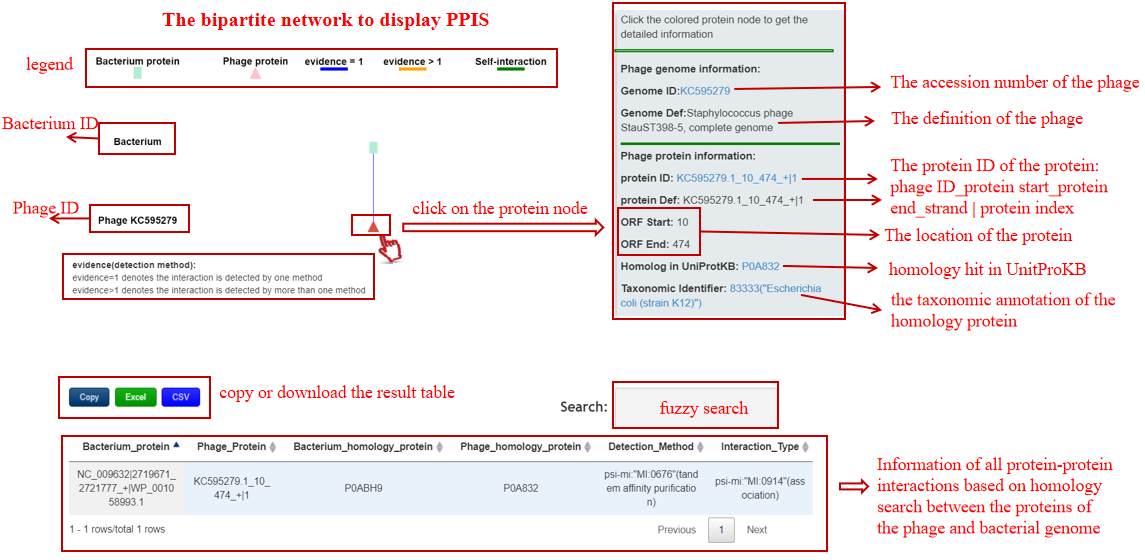
A table contains the detailed information of PPIs between the bacterium-phage pair and the description is shown in the following:
| Header | Description |
|---|---|
| Bacterium_protein | Bacterium ID|protein location|protein ID in NCBI or Bacterium ID_protein location |
| Phage_protein | phage ID|protein location|protein ID in NCBI or phage ID_protein location |
| Bacterium_homolog_protein | The pfam ID of the protein homology with the baterial protein |
| Phage_homolog_protein | The pfam ID of the protein homology with the phage protein |
| Detection_Method | The method for detecting this PPI |
| Interaction_Type | The type for this PPI |
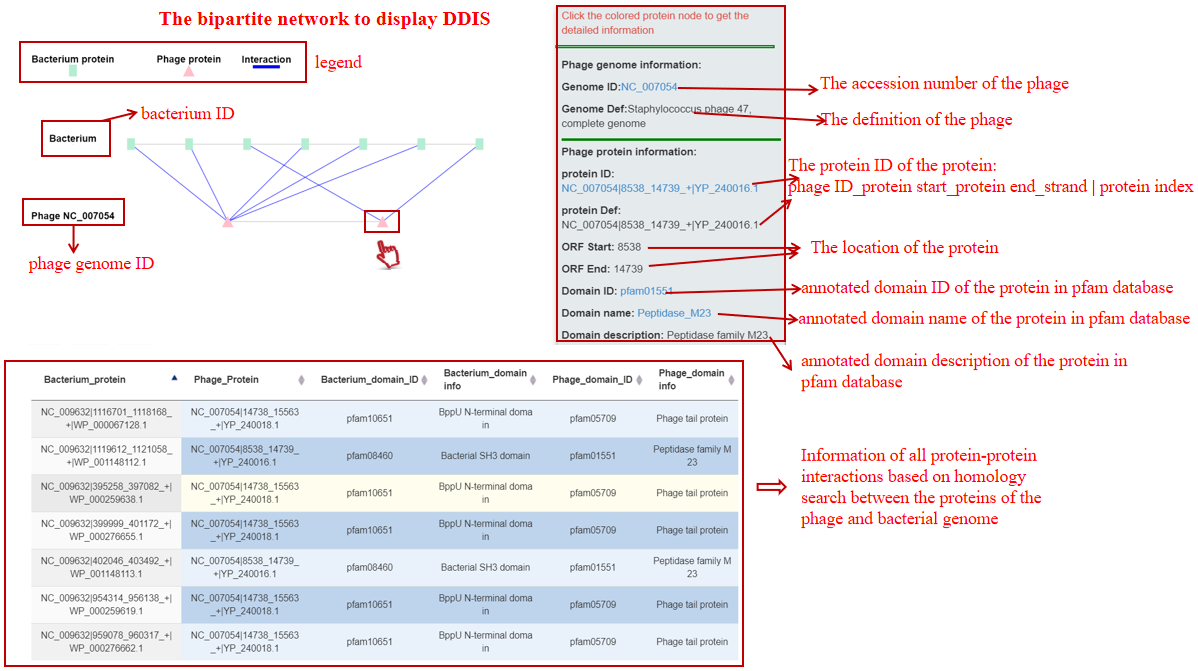
A table contains the detailed information of DDIs between the bacterium-phage pair and the description is shown in the following:
| Header | Description |
|---|---|
| Bacterium_protein | Bacterium ID|protein location|protein ID in NCBI or Bacterium ID_protein location |
| Phage_protein | phage ID|protein location|protein ID in NCBI or phage ID_protein location |
| Bacterium_domain_ID | The pfam ID of the bacterial protein domain best matched using hmmscan |
| Bacterium_domain_info | The description of the bacterial protein domain |
| Phage_domain_ID | The pfam ID of the phage protein domain best matched using hmmscan |
| Phage_domain_info | The description of the phage protein domain |
If a phage genome sequence has been submitted, PHISDetector will predict the potential hosts for the query phage. Use criterion 1 to get the hosts with high confidence level and use Criterion 2 to get candidate hosts that will be sent to machine learning models for validation. Next, all the predicted hosts with the query phage will be sent to PHIE module to detect diverse in silico PHISs (18 features) including CRISPR, Prophage, Genetic homology ,Sequence composition and PPI. Finally, a consensus analysis is performed to indicate the possible integrity of the predicted interactions.
Output[link to result]
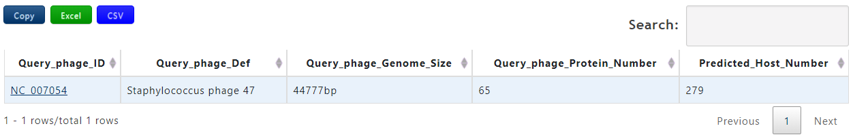
| Header | Description |
|---|---|
| Query_phage_ID | The accession number of query phage |
| Query_phage_Def | The definition information of query phage |
| Query_Genome_Size(bp) | The genome length of the query phage |
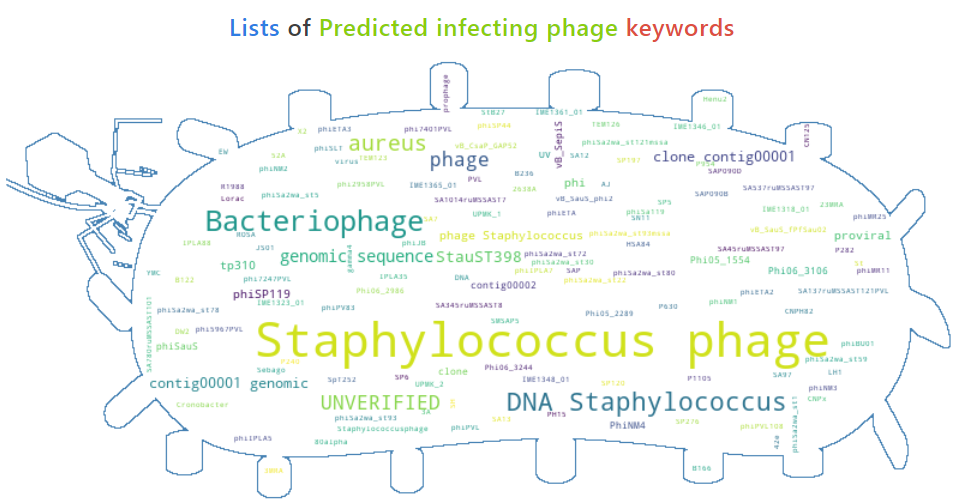
| Predicted_Host_number | The number of predicted host sequences of the query phage |
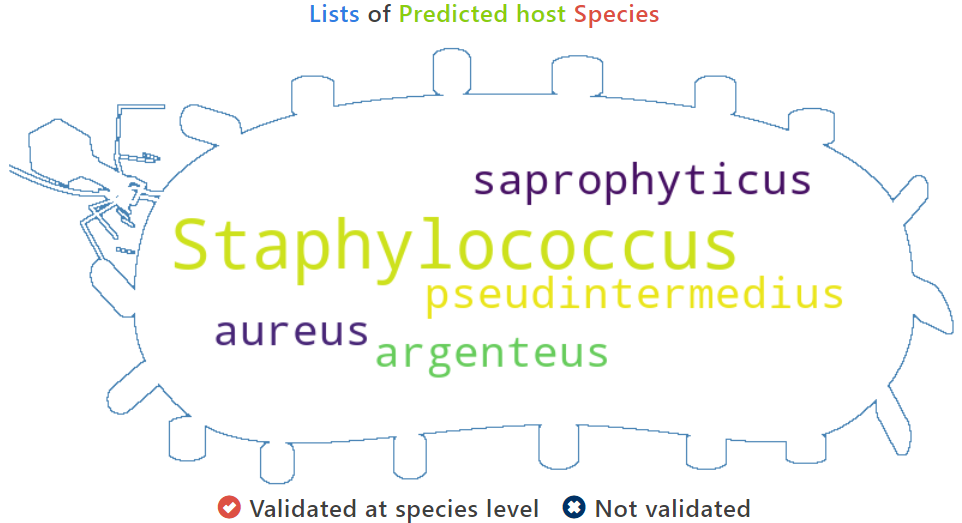
The following wordcloud picture displays the species of the predicted hosts of the query phage
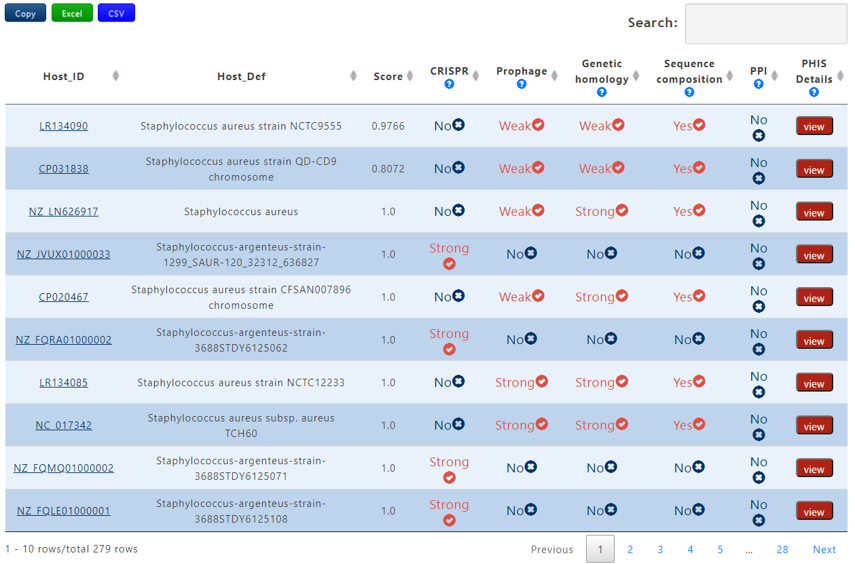
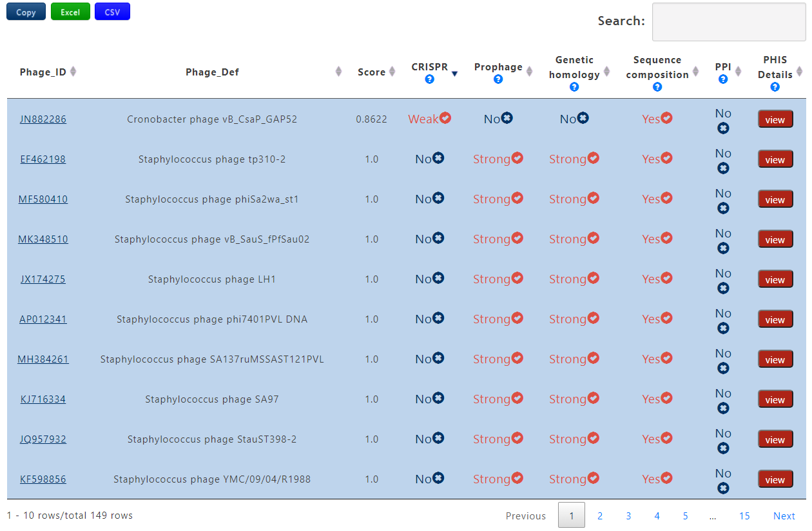
A table contains the detailed information of predicted hosts and the description is shown in the following:
| Header | Description |
|---|---|
| Host_ID | The accession number of the predicted host |
| Host_Def | The definition information of the predicted host |
| Score | The average probablity of the interaction calculated by 7 trained machine learning models. If the the bacterium-phage pair passes Criterion 1, the score will be assigned 1 |
| CRISPR | Strong, Weak or No. Strong denotes that the bacterium-phage pair passes Criterion 1 in CRISPR, Weak denotes that the bacterium-phage pair passes Criterion 2 in CRISPR but not for Criterion 1 and No means that the bacterium-phage pair fails to pass any Criterion |
| Prophage | Strong, Weak or No. Strong denotes that the bacterium-phage pair passes Criterion 1 in Prophage, Weak denotes that the bacterium-phage pair passes Criterion 2 in Prophage but not for Criterion 1 and No means that the bacterium-phage pair fails to pass any Criterion |
| Genetic homology | Strong, Weak or No. Strong denotes that the bacterium-phage pair passes Criterion 1 in Genetic homology, Weak denotes that the bacterium-phage pair passes Criterion 2 in Genetic homology but not for Criterion 1 and No means that the bacterium-phage pair fails to pass any Criterion |
| Sequence composition | Yes or No. Yes denotes that the bacterium-phage pair passes Criterion 2 in Sequence composition and No means the reverse. |
| PPI | Yes or No. Yes denotes that the bacterium-phage pair passes PHIS Criterion 2 in PPI and No means the reverse. |
| PHIS Details | click the view button to get the result page of PHIE module between the phage-host pair |
If a bacterial genome sequence has been submitted, PHISDetector will predict the infecting phages for the query bacteria. Use criterion 1 to get the infecting phages with high confidence level and use Criterion 2 to get candidate infecting phages that will be sent to machine learning models for validation. Next, all the predicted phages with the query bacterium will be sent to PHIE module to detect diverse in silico PHISs (18 features) including CRISPR, Prophage, Genetic homology, Sequence composition and PPI. Finally, a consensus analysis is performed to indicate the possible integrity of the predicted interactions.

Output[link to result]
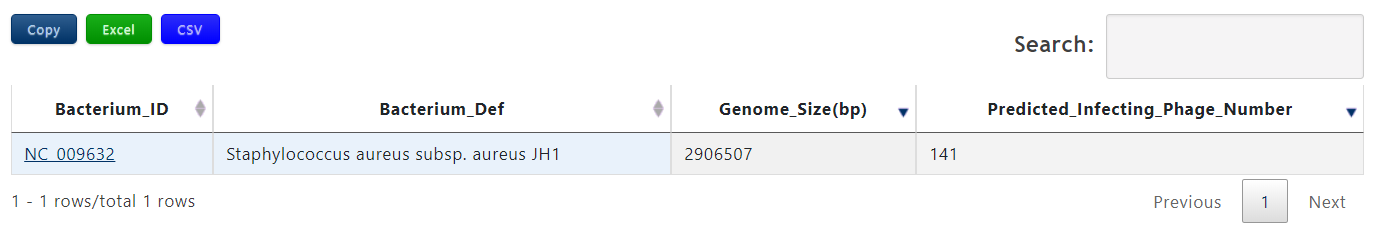
| Header | Description |
|---|---|
| Bacterium_ID | The accession number of query bacterium |
| Bacterium_Def | The definition information of query bacterium |
| Bacterium_Genome_Size(bp) | The genome length of the query bacterium |
| Predicted_infecting_phage_number | The number of the predicted phages infecting the query bacterium |
A table contains the detailed information of predicted interacting phages and the description is shown in the following:
| Header | Description |
|---|---|
| Phage_ID | The accession number of the predicted phage |
| Phage_Def | The definition information of the predicted phage |
| Score | The average probablity of the interaction calculated by 7 trained machine learning models. If the the bacterium-phage pair passes PHIS Criterion 1, the score will be assigned 1 |
| CRISPR | Strong, Weak or No. Strong denotes that the bacterium-phage pair passes Criterion 1 in CRISPR, Weak denotes that the bacterium-phage pair passes Criterion 2 in CRISPR but not for Criterion 1 and No means that the bacterium-phage pair fails to pass any Criterion |
| Prophage | Strong, Weak or No. Strong denotes that the bacterium-phage pair passes Criterion 1 in Prophage, Weak denotes that the bacterium-phage pair passes Criterion 2 in Prophage but not for Criterion 1 and No means that the bacterium-phage pair fails to pass any Criterion |
| Genetic homology | Strong, Weak or No. Strong denotes that the bacterium-phage pair passes Criterion 1 in Genetic homology, Weak denotes that the bacterium-phage pair passes Criterion 2 in Genetic homology but not for Criterion 1 and No means that the bacterium-phage pair fails to pass any Criterion |
| Sequence composition | Yes or No. Yes denotes that the bacterium-phage pair passes Criterion 2 in Sequence composition and No means the reverse. |
| PPI | Yes or No. Yes denotes that the bacterium-phage pair passes Criterion 2 in PPI and No means the reverse. |
| PHIS Details | click the view button to get the result page of PHIE module between the phage-host pair |
Taxonomy format
Definition
Taxonomy format file consists the description of taxonomy of bacteria, taxonomic ranks are species, genus, family, order, class, phylum, kingdom.The taxonomy format needed in our pipeline consists of a definition line and the taxonomic information of per bacteria. One lines represents a bacteria, containing the file name, strain name and taxon name of bacteria, those names are tab delimited.
note:
- Bacteria and phage file named by Accession id from NCBI plus “.fasta” or “.gb” is the recommended, and some characters such as space should not appear in file name avoiding unnecessary problems.
- The first column in taxonomy format file must be consistent with the file name of input sequence, including the extension.
- There should be no missing taxon name, fill those with text such as ‘NA’ or ‘unkown’
Example
hostNCBIName    hostName    hostSuperkingdom    hostPhylum    hostClass    hostOrder    hostFamily    hostGenus    hostSpecies
NZ_CP007536.fasta    Nitrososphaera viennensis EN76    Archaea    Thaumarchaeota    Nitrososphaeria    Nitrososphaerales    Nitrososphaeraceae    Nitrososphaera    Nitrososphaera viennensis
NC_010482.fasta    Candidatus Korarchaeum cryptofilum OPF8    Archaea    Candidatus Korarchaeota    NA    NA    NA    Candidatus Korarchaeum    Candidatus Korarchaeum cryptofilum
NZ_CP011267.fasta    Geoglobus ahangari    Archaea    Euryarchaeota    Archaeoglobi    Archaeoglobales    Archaeoglobaceae    Geoglobus    Geoglobus ahangari
NC_000917.fasta    Archaeoglobus fulgidus DSM 4304    Archaea    Euryarchaeota    Archaeoglobi    Archaeoglobales    Archaeoglobaceae    Archaeoglobus    Archaeoglobus fulgidus
NC_021169.fasta    Archaeoglobus sulfaticallidus PM70-1    Archaea    Euryarchaeota    Archaeoglobi    Archaeoglobales    Archaeoglobaceae    Archaeoglobus    Archaeoglobus sulfaticallidus
NZ_CP006577.fasta    Archaeoglobus fulgidus DSM 8774    Archaea    Euryarchaeota    Archaeoglobi    Archaeoglobales    Archaeoglobaceae    Archaeoglobus    Archaeoglobus fulgidus
NC_015320.fasta    Archaeoglobus veneficus SNP6    Archaea    Euryarchaeota    Archaeoglobi    Archaeoglobales    Archaeoglobaceae    Archaeoglobus    Archaeoglobus veneficus
NC_013849.fasta    Ferroglobus placidus DSM 10642    Archaea    Euryarchaeota    Archaeoglobi    Archaeoglobales    Archaeoglobaceae    Ferroglobus    Ferroglobus placidus
Method
Oligonucleotide profile analysis predict the relationship between bacteria and phage based on the phenomenon that the codon usage or short nucleotide words (k-mers) are highly similar between phages with their hosts. The bacteria with highest similarity is used for the prediction of the potential host for a query phage. The core challenge of prediction by Oligonucleotide profile analysis is how to compute the Oligonucleotide frequency (ONF). We provide two methods for computing the ONF in out pipeline, which are VirHostMatcher and WIsH.
VirHostMatcher
VirHostMatcher approximates the oligonucleotide frequency (ONF) by calculating the distance/dissimialrity between a pair of bacteria and phage sequences. We set the option to only compute d2star dissimilarity, more detail information about the VirHostMathcer could be seen in the article [3].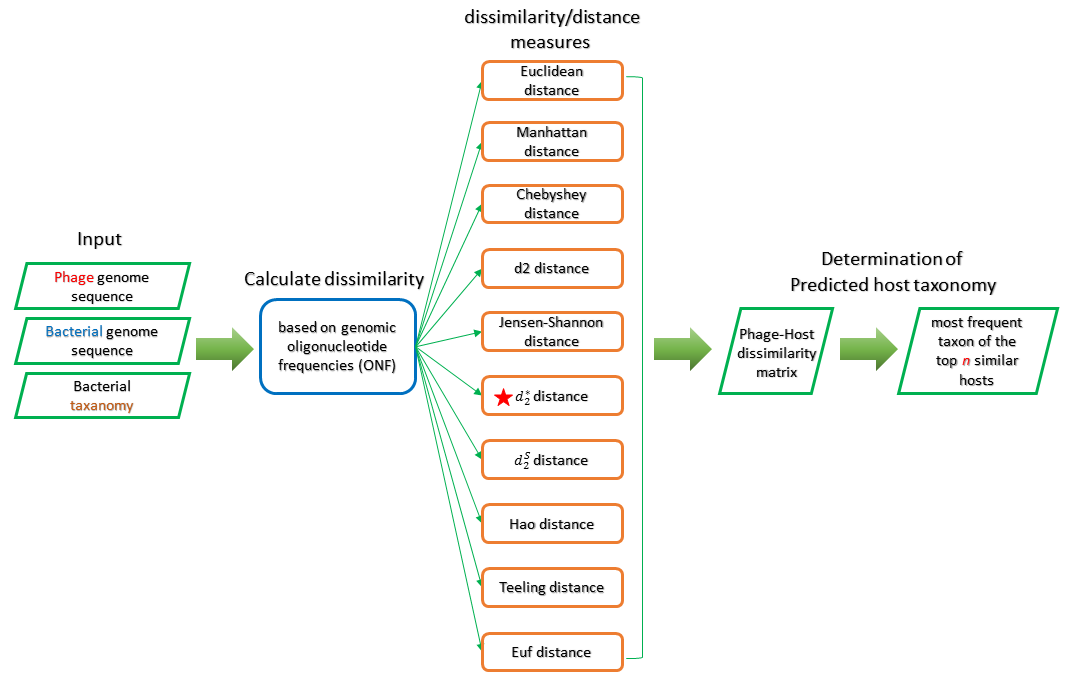
WIsH
WIsH approximates the oligonucleotide frequency (ONF) by calculating the likelihood of between a pair of bacteria and phage sequences under each of the trained Markov models. Furthermore, the other advantage of using WIsH to predict is that it could achieve well accuracy for contigs as short as 3kbp.More detail information about the WIsH could be seen in the article [4].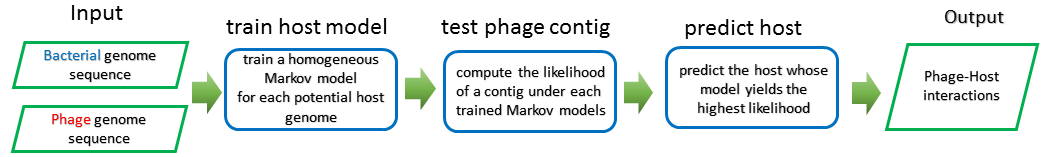
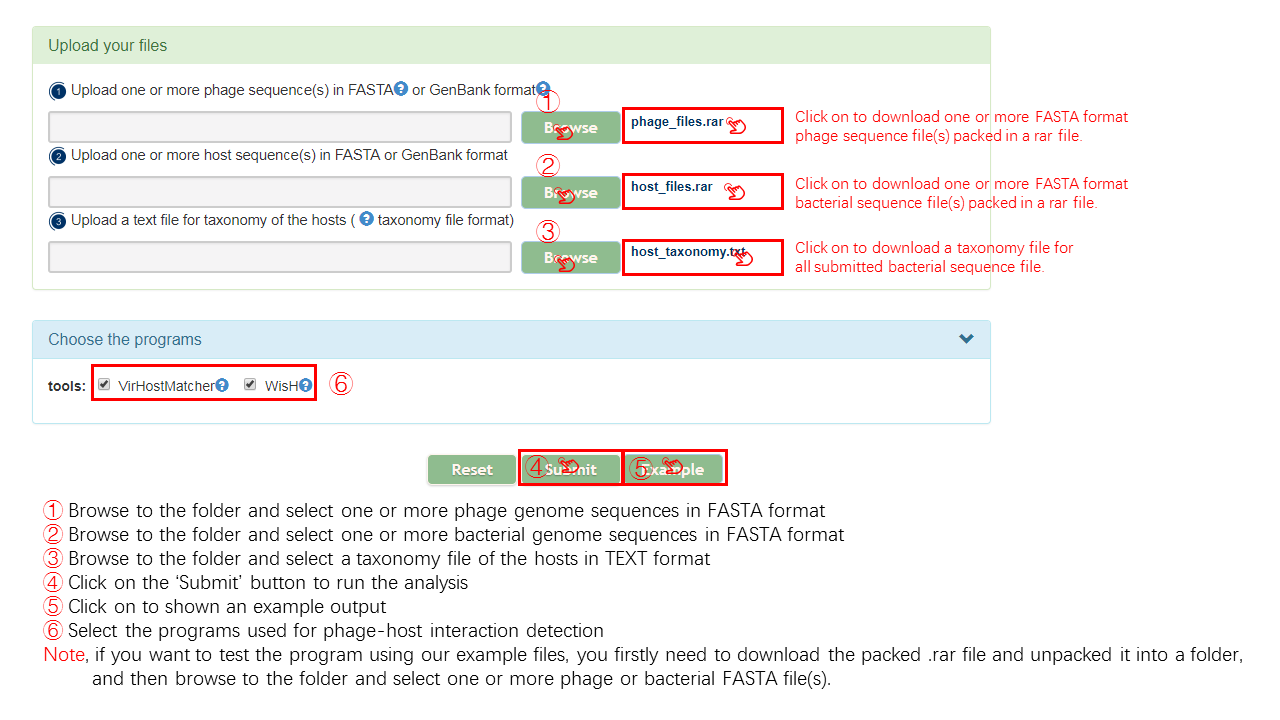
Input
Output[link to result]
VirHostMatcher
A Heatmap is generated to display the relationship of a pair of bacteria and phage based on the Oligonucleotide profile analysis detected by VirHostMatcher.
- Each line display the top 6 potential bacteria host of query phage,The color range from red to green, intensity indicates the distance/dissimialrity between pairs of bacteria and phage sequences. The color intensity decreases along with increasing distance/dissimialrity.
- Each cell represent the relationship of one pair of bacteria and phage, the detail information will be displayed when the cursor foucus on that cell.
- The cells color of the same color as those on the color bar which is beside the heatmap will be highlighted when the cursor foucus on that.
The table contains the detail information of prediction, the description is shown in the following
| Header | Description |
|---|---|
| Phage_ID | The accession id of the query phage |
| Phage_Def | The definiton information of the query phage |
| Host_ID(best hit) | The accession id of the most protential bacteria host by Oligonucleotide profile analysis |
| Host_Def(best hit) | The definiton information the most protential bacteria host by Oligonucleotide profile analysis |
| Best_Consensus_Taxon | The best consensus of taxon according to the top 6 potential bacteria host. |
WIsH
A table is generated to display the relationship of a pair of bacteria and phage based on the Oligonucleotide profile analysis detected by WIsH. The table contains the detail information of prediction, and the description is shown in the following.
| Header | Description |
|---|---|
| Phage_ID | The accession id of the query phage |
| Phage_Def | The definiton information of the query phage |
| Host_ID(best hit) | The accession id of the most protential bacteria host by Oligonucleotide profile analysis |
| Host Def(best hit) | The definiton information the most protential bacteria host by Oligonucleotide profile analysis |
| LogLikelihood | The LogLikelihood value of one pair of phage and bacteria . |
Output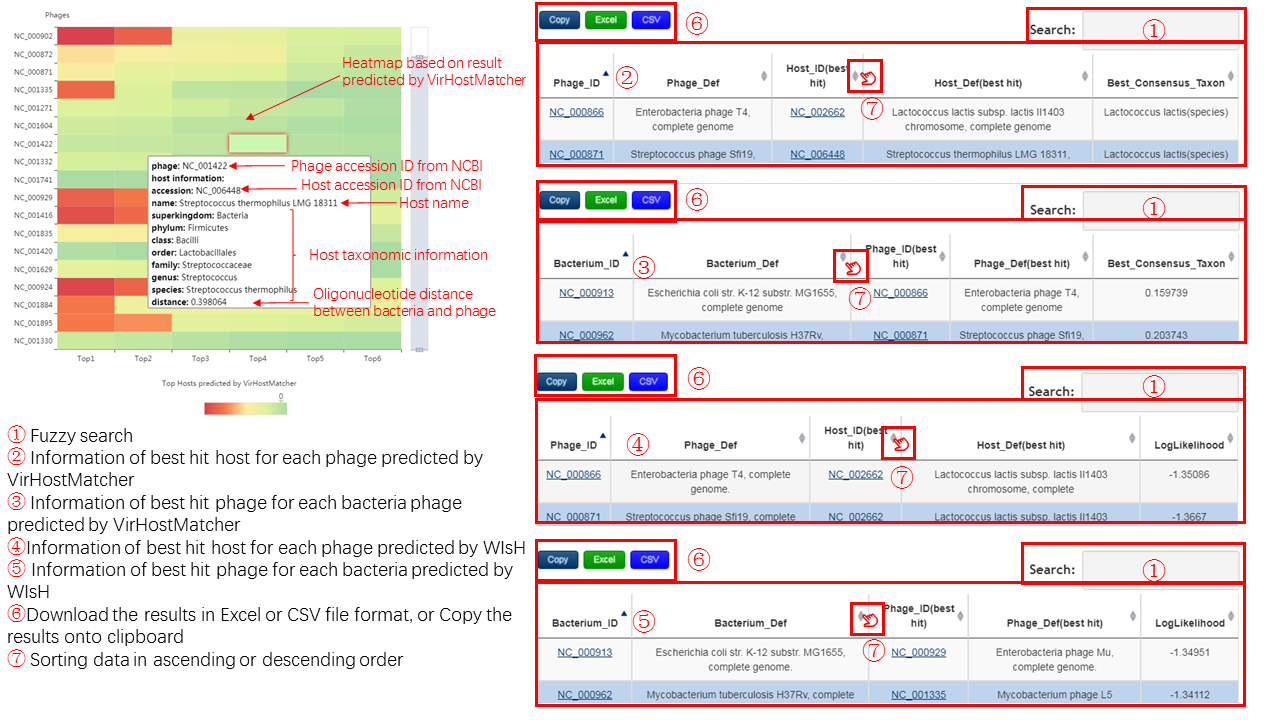
File format
Seq2CRISPR format
Definition
Spacer file format obtained from Seq2CRISPR[5] is a text-based format, the spacer sequences are represented using single-letter codes. The spacer file starts with a single comment line and is followed by sequence lines. A greater-than (“>”) symbol is used before the first character of the comment line to distinguish it from sequence lines.
Example
>4211:c1:p42 Aact_B_G_3_M3_X
CATTGTTATTCCTGTTAATCGTTTGAACTTATGAA
>4211:c1:p109 Aact_B_G_3_M3_X
GTCCGATTAAAGCGTTATCTGTTTCTGACGGTAAA
>7303:c1:p42 Aaph_A_G_1_M3_X
AAGATAAGCTAGAAATATCCCTTAACGATAGAT
>7303:c1:p107 Aaph_A_G_1_M3_X
ATCATATCCTACTAAGAAACGTTATAGACACTTG
>7303:c1:p173 Aaph_A_G_1_M3_X
AGGCGGAAGATTTGTTTACTTAAACAGCGATAG
>7717:c1:p195 Aaph_A_G_1_M3_X
ATTTTAGGATCACCCTTCTTGTTGTCTTGATGTT
>7717:c1:p261 Aaph_A_G_1_M3_X
GCTTGTGTTGATTGGCGATCTAACATTGACAAC
>8409:c1:p36 Sthe5_M_G_3_M14_F27
TAACGCTCCCTATACCCAATTCAGGAATAG
>8409:c1:p102 Sthe5_M_G_3_M14_F27
GCGAATGCCGTCCATACTTGGGAAGTATTC
>8409:c1:p168 Sthe5_M_G_3_M14_F27
ACAAAGGCTTTGTCTGTGTTTGTTTGACTG
>8409:c1:p234 Sthe5_M_G_3_M14_F27
GCAGAAATGAATACGCCATAACCAATACCT
>8571:c1:p297 Sthe5_M_G_3_M14_F27
GACACGGAGAAAGACCCAGACGCAAAACCT
>8571:c1:p363 Sthe5_M_G_3_M14_F27
TAATAGCAAGTAAGACGTCAAAAATGTAAT
CRISPRFinder format
Definition
Spacer file format obtained from CRISPRFinder[6] is a text-based format for spacer sequence information detected by CRISPRCasFinder.
Example
>1.1|341503|35|NZ_CP027422
GCAGCTCAGGCGTTCCTCTTTTTACTTTCAGCTTG
>2.1|382030|26|NZ_CP027422
TTGATTCGGCGGTTCGCATGCTCCCC
>3.1|1670995|26|NZ_CP027422
GAAGACTGCGAACCAAAGTAAAAGAA
>4.1|2116937|38|NZ_CP027422
GACTTATGCATGAGCAGAAGCTCAGGTAATCCTTAAAA
PILER-CR format
Definition
Result file obtained from PILER-CR[7] is a text-based format for crispr information including CRISPR array, repeat and spacer. This file consists of threr parts, detailed information, summary by similarity and summary by position. The specific format could be seen in example.
Example
pilercr v1.0
By Robert C. Edgar

/p/db/bact/fasta/Acinetobacter_calcoaceticus: 3 putative CRISPR arrays found.


DETAIL REPORT


Array 1
>gi|50083297|ref|NC_005966.1| Acinetobacter sp. ADP1, complete genome

       Pos  Repeat     %id  Spacer  Left flank    Repeat                          Spacer
==========  ======  ======  ======  ==========    ============================    ======
   2339398      28   100.0      32  AGAAGCAAGA    ............................    CAGAAACGGCGGGTACACGTGTCACGGTGAAT
   2339458      28   100.0      32  CACGGTGAAT    ............................    ATCGCTATTCTGACCCAGAAATTAACAATCAC
   2339518      28   100.0      32  TAACAATCAC    ............................    TCATGATACGTGCAGTACCATCTGCTGGATTA
   2339578      28    96.4      32  TGCTGGATTA    ....................T.......    ACTTAATGCGGAACCGACATCTGTACTAGTGA
   2339638      28   100.0      32  GTACTAGTGA    ............................    TATTGAGCAAGCGATTGACGGTTATGCGCGTT
   2339698      28   100.0          TATGCGCGTT    ............................    AGTAAATATTG
==========  ======  ======  ======  ==========    ============================
         6      28              32                TTTCTAAGCTGCCTGTGCGGCAGTTAAG


Array 2
>gi|50083297|ref|NC_005966.1| Acinetobacter sp. ADP1, complete genome

       Pos  Repeat     %id  Spacer  Left flank    Repeat                          Spacer
==========  ======  ======  ======  ==========    ============================    ======
   2371799      28   100.0      32  CTTTCTTACT    ............................    TCACACTGCACTTGCGATTGGGGCACTATCAA
   2371859      28   100.0      32  GCACTATCAA    ............................    AATGTCGTGAACACTCAGACAGGCGGATACCA
   2371919      28   100.0      33  GCGGATACCA    ............................    CGACAGAGCAAGACATCACTGATATGTCGAATT
   2371980      28   100.0      32  ATGTCGAATT    ............................    GCAGTCGGACAACTTCAATCGAACGCATCATC
   2372040      28   100.0      32  ACGCATCATC    ............................    CTGCTTCTCGGTCATCCTTAAATCTGAATGAG
   2372100      28   100.0      32  TCTGAATGAG    ............................    TCACACTGCACTTGCGATTGGGGCACTATCAA
   2372160      28   100.0      32  GCACTATCAA    ............................    AATGTCGTGAACACTCAGACAGGCGGATACCA
   2372220      28   100.0      33  GCGGATACCA    ............................    CGACAGAGCAAGACATCACTGATATGTCGAATT
   2372281      28   100.0      32  ATGTCGAATT    ............................    GCAGTCGGACAACTTCAATCGAACGCATCATC
   2372341      28   100.0      32  ACGCATCATC    ............................    CTGCTTCTCGGTCATCCTTAAATCTGAATGAG
   2372401      28   100.0      32  TCTGAATGAG    ............................    TTCCACCAATCAAGAGTGGATTGGTCAATAGT
   2372461      28   100.0      32  GGTCAATAGT    ............................    AGTCGACCGCGAGACGGGAAAAAGTACGAACA
   2372521      28   100.0      32  AGTACGAACA    ............................    CGTAGACTGCCACCACCGCACCCCCATACATT
   2372581      28   100.0      32  CCCATACATT    ............................    TCGCGCAATCCATCGCGAGGGGCCTATTCGAG
   2372641      28   100.0      32  CCTATTCGAG    ............................    AATGAGAAAATCAAACCACCCATGATGATCGT
   2372701      28   100.0      28  TGATGATCGT    ............................    TACTCGAACTTGTCTGTCATATTGCCCT
   2372757      28    89.3      32  ATATTGCCCT    TAC.........................    TGAATACTCAAATGACAATAAACAGGATAAAG
   2372817      28   100.0      32  CAGGATAAAG    ............................    TGTGAACAAATCCGTTGTAAGCCGCGCCTTAT
   2372877      28   100.0      32  CGCGCCTTAT    ............................    ATTTAAAAGCCACTCATCTGACACACCTAAAA
   2372937      28   100.0      33  ACACCTAAAA    ............................    TTATCGAAGTATTCTGCTTTGGGTGCGGCAATG
   2372998      28   100.0          TGCGGCAATG    ............................    ACCAGAAATGATTCCAGATATTCCAGATGAATCC
==========  ======  ======  ======  ==========    ============================
        21      28              31                CTTCACTACCGCACAGGTAGCTTAGAAA


Array 3
>gi|50083297|ref|NC_005966.1| Acinetobacter sp. ADP1, complete genome

       Pos  Repeat     %id  Spacer  Left flank    Repeat                          Spacer
==========  ======  ======  ======  ==========    ============================    ======
   2448115      28   100.0      32  CTTAACTCTA    ............................    GACACCAAAGGTAATAAAGCTATGAAAGAATA
   2448175      28   100.0      32  TGAAAGAATA    ............................    TTTACTCTTATTATACTATTACCCCTAACCCC
   2448235      28   100.0      32  CCCTAACCCC    ............................    TCCAGCTAAAATCGTTTGAGGGTGAAACTCCT
   2448295      28   100.0      32  TGAAACTCCT    ............................    ATGATTTCGAAAGGCTCTCCGAGTACGTTATT
   2448355      28   100.0      32  GTACGTTATT    ............................    ATTCCCAGCATTCACGCTGAGTGCTTCGGCAC
   2448415      28   100.0      32  GCTTCGGCAC    ............................    TGTGCAGCCGTTTGGCGCGCCCCAGATATGCG
   2448475      28   100.0      32  CAGATATGCG    ............................    AGGAACCGTGGCAGATTGCGTTAATATGTTAG
   2448535      28   100.0      32  AATATGTTAG    ............................    TAACGATGGAATAACGTTCAAAGAATCTAACG
   2448595      28   100.0      32  GAATCTAACG    ............................    AATTCATGAAAGATCATTCGCTGTGTTTGGGG
   2448655      28   100.0      32  GTGTTTGGGG    ............................    ATTTGCCGCTTTGAATATTTGATGCACCTGCT
   2448715      28   100.0      32  TGCACCTGCT    ............................    AAATCGATGAGGGACAACATCAGGCACTCGAC
   2448775      28   100.0      32  GGCACTCGAC    ............................    ACAGGGCAGGGAAATAACCAAAAATCGATATA
   2448835      28   100.0      32  AATCGATATA    ............................    GACATAGGAACGATATGAAGATGATTTTTTTT
   2448895      28   100.0      32  GATTTTTTTT    ............................    ATCAAGCTATCGTCATTTGGCCGATACACAGC
   2448955      28   100.0      32  GATACACAGC    ............................    TCTGCCATGCATACAATTTGATTTGGCTGCGT
   2449015      28   100.0      32  TTGGCTGCGT    ............................    AATCATCAATATCTTTTTGCGCTTTGCGTGAA
   2449075      28   100.0      32  TTTGCGTGAA    ............................    TCTCACGTACAAAAAAAAATCCTATTTGATGT
   2449135      28   100.0      32  TATTTGATGT    ............................    GCGATTGAATACCGATAGATCGGGGATATTAA
   2449195      28   100.0      33  GGGATATTAA    ............................    ATACACTACATTGAACTGCTCGGACTTAAGCAT
   2449256      28   100.0      32  ACTTAAGCAT    ............................    AAAAAAAGTGTAGCCAACTTCATACAGTTACC
   2449316      28   100.0      32  TACAGTTACC    ............................    CAGGTGGCAGCGTTCCATTTTCGGGGGCAAAT
   2449376      28   100.0      32  GGGGGCAAAT    ............................    AAAACCACATTATAAGGCTCGGTAAATGTGTA
   2449436      28   100.0      32  TAAATGTGTA    ............................    ATGAAAATAAGCCCCAATATTGTCAGTGTTCC
   2449496      28   100.0      32  TCAGTGTTCC    ............................    GTTTCCGCGTCATTCGGGTACAGTTGCGACAT
   2449556      28   100.0      32  GTTGCGACAT    ............................    TTGAAACCTATGAACTTTGTGTTATACGTGTC
   2449616      28   100.0      32  TATACGTGTC    ............................    CTTATCAAAATCGGTGGGATCTTTGTCGTACT
   2449676      28   100.0      32  TTGTCGTACT    ............................    GAATTATGCTTTAAAAAATCCTTTCGCGGGTA
   2449736      28   100.0      32  TTCGCGGGTA    ............................    AATCCGATTTCTGCTGTTGCTGGGGTTAGAGC
   2449796      28   100.0      32  GGGTTAGAGC    ............................    ATGTACTATAAGTCACATGGTAAAGACACGAA
   2449856      28   100.0      32  AAGACACGAA    ............................    GAAACGTTGAATCCAGAACCAGCAATCCCAGC
   2449916      28   100.0      32  CAATCCCAGC    ............................    AAACTGTGGAGCATTACATCTACCATACTGCC
   2449976      28   100.0      32  CCATACTGCC    ............................    TAAAACAGTCAATGTTAATTGGGGTGAACAAT
   2450036      28   100.0      32  GGTGAACAAT    ............................    GCGGTAGCTGGCGCGGTGTTTGCGTTTTTTGG
   2450096      28   100.0      32  CGTTTTTTGG    ............................    TATAACTAGCATGTCAGAAATAAAACTATCCG
   2450156      28   100.0      32  AAACTATCCG    ............................    CGTTGGTACTGTTGCAGGTGGTGCATTGGGGA
   2450216      28   100.0      32  GCATTGGGGA    ............................    GACTCCGCTACTTAAGAAAGAGAGCATAGGTG
   2450276      28   100.0      32  AGCATAGGTG    ............................    TAGAAGTAACTTACGATAACATCTTTGGCGCC
   2450336      28   100.0      32  CTTTGGCGCC    ............................    TCAAGCATGTGATCACTAATGATTCGGTTTTT
   2450396      28   100.0      32  TTCGGTTTTT    ............................    TATACTCCTTATATGTAATTTACGCGTAAACC
   2450456      28   100.0      32  CGCGTAAACC    ............................    CACTACATTTATACCCGCCGTTTACGCTCTTA
   2450516      28   100.0      32  TACGCTCTTA    ............................    GTTTAATGTGGCGTTCAGGTCTTGTTCGCCAA
   2450576      28   100.0      32  TGTTCGCCAA    ............................    ACTCAGTTGACCAATCTTACTGCTTCACTTAA
   2450636      28   100.0      32  CTTCACTTAA    ............................    AGAAGATTTGGTGGGCAAAAATATGGAATATA
   2450696      28   100.0      32  ATGGAATATA    ............................    ATTCTTAGCTGCATCACGCAAGATTTGCTTTT
   2450756      28   100.0      32  ATTTGCTTTT    ............................    CTCATCGAAACATACATTGAGAAAAATCATTT
   2450816      28   100.0      32  AAAATCATTT    ............................    AATCATCATCGACCGCAGTATTGAAGCGAAGC
   2450876      28   100.0      32  GAAGCGAAGC    ............................    AGCCCTTCGTATATTTGAATAGTGCATTGGCT
   2450936      28   100.0      31  TGCATTGGCT    ............................    AAAAATACCCGCGCCCAAGTGATCCTGAAGA
   2450995      28   100.0      32  ATCCTGAAGA    ............................    AACCATATAGAATTGTTAACTTTTGTAAATAA
   2451055      28   100.0      32  TTGTAAATAA    ............................    GATCAAAACAACAAGCGTACCAATGATGCCGA
   2451115      28   100.0      32  ATGATGCCGA    ............................    ACAAGGGATGTATTGACCAGGTGTGAGCGCAA
   2451175      28   100.0      32  GTGAGCGCAA    ............................    ATTCTTGAGCCGCCTGCAGATTTGTTATGTCA
   2451235      28   100.0      32  TGTTATGTCA    ............................    ATGGTTCGGGGTTGTAGCTGTACGCCCCAGAT
   2451295      28   100.0      32  CGCCCCAGAT    ............................    AAGAGCAAAAGGTAACTTGGATCTACCGCCAC
   2451355      28   100.0      32  CTACCGCCAC    ............................    CACGGAAATTGGAATGATGATTTCGACGGTAA
   2451415      28   100.0      32  TCGACGGTAA    ............................    TTGTTGAGCAGCAGAACGGCCTTTTACCAACC
   2451475      28   100.0      32  TTTACCAACC    ............................    AGATACCTCAGTCCAAGCTGCTGAATTTTATC
   2451535      28   100.0      32  GAATTTTATC    ............................    AAGAGACAACAGGGCTTATTAAAGTAACTTGT
   2451595      28   100.0      32  AGTAACTTGT    ............................    AAGTTTTATTTAAGCCCAAAGCTAAAGATAGT
   2451655      28   100.0      32  TAAAGATAGT    ............................    GTTAGCTGCACAAGCTCTGGGACTTTAATAAA
   2451715      28   100.0      32  CTTTAATAAA    ............................    AATCGCTAACCAGTAGAACCCGCGTAGCAGCG
   2451775      28   100.0      32  CGTAGCAGCG    ............................    AAGCGTTGCGAGCGCTCAAAAAGTGGCTGATC
   2451835      28   100.0      32  GTGGCTGATC    ............................    GTCTACCAAAGCGAAAGTATCATTTTCAATGA
   2451895      28   100.0      32  TTTTCAATGA    ............................    TGTATCGGAGCTACGTCAGAAGGTCAAGCACA
   2451955      28   100.0      32  GTCAAGCACA    ............................    AGGTCGATTTATCATAAACATCGGGCACGATA
   2452015      28   100.0      32  GGGCACGATA    ............................    GCCAGAAATTTTGACACTTGCGTTTAGCAATA
   2452075      28   100.0      32  TTTAGCAATA    ............................    AGATTGTCTCTAAATTTAACGCGTGGCTTTGT
   2452135      28   100.0      32  GTGGCTTTGT    ............................    AAAGCCGAGCCCAACTTTTGACGCACAAAAAG
   2452195      28   100.0      32  GCACAAAAAG    ............................    GTCAGTGATTGCTTTCATTGCCGTAGCTACGT
   2452255      28   100.0      32  GTAGCTACGT    ............................    ATCCGCGCCCAATTTGTCCCACCAATCTTTTT
   2452315      28   100.0      32  CAATCTTTTT    ............................    GATTCCATAGAACGTACCATTGACGCGCAACA
   2452375      28   100.0      32  ACGCGCAACA    ............................    TGGATCTCTGCAGAAATCACATTGTCCAAATA
   2452435      28   100.0      32  TGTCCAAATA    ............................    AACAGGCGTTACTGAGCTATGTGTCGTTAAAA
   2452495      28   100.0      32  GTCGTTAAAA    ............................    AAGCATGCCTTGATGCATACAACAAAATTGCC
   2452555      28   100.0      32  CAAAATTGCC    ............................    TGCGAGTTCAAACTTCTTTAAAGATGCAACAT
   2452615      28   100.0      32  GATGCAACAT    ............................    CGTGGAATCATAATCATAAGCTTCACCGACAC
   2452675      28   100.0      32  TCACCGACAC    ............................    GATCAGTGGCGCGTCTACAGTGAGCGAGTGGG
   2452735      28   100.0      32  AGCGAGTGGG    ............................    ATAATTGCAACAACAGCATAATATACATACCA
   2452795      28   100.0      32  ATACATACCA    ............................    CTTACTTTCGCTTGCGCTTCGTTACGAATGCC
   2452855      28   100.0      32  TACGAATGCC    ............................    TCAACCAGGATCGGATAACCATCAATTCTAAA
   2452915      28   100.0      32  CAATTCTAAA    ............................    AACAGGCGTTACTGAGCTATGTGTCGTTAAAA
   2452975      28   100.0      32  GTCGTTAAAA    ............................    AAGCATGCCTTGATGCATACAACAAAATTGCC
   2453035      28   100.0      32  CAAAATTGCC    ............................    CAAATGTAATCAGGATTAGTCGATTGCAGCGT
   2453095      28   100.0      32  ATTGCAGCGT    ............................    AGATCGCCTGTGCGTAGGTCAACTGCACCATT
   2453155      28   100.0      32  CTGCACCATT    ............................    AGCTGAACACGCCGTTTTTTAACTTCCGCCAT
   2453215      28   100.0      32  CTTCCGCCAT    ............................    ATGCACCTGATCCTGCCCAATGAGGGATTTAC
   2453275      28    96.4      32  AGGGATTTAC    A...........................    TGATGGTGCAGGAACCACAGCAACATCAGTCA
   2453335      28   100.0      32  ACATCAGTCA    ............................    GATTGAAATACTATTAAGGCTGTTCGTAAAGC
   2453395      28   100.0      32  TTCGTAAAGC    ............................    ACACACGCTGCCAATTCTTCGTTAGAGTGTAT
   2453455      28   100.0      32  TAGAGTGTAT    ............................    AGCAGTAAAAGCCATGACCGTTAAGATCGCTC
   2453515      28   100.0          AAGATCGCTC    ............................    TATTAAAAGC
==========  ======  ======  ======  ==========    ============================
        91      28              32                GTTCGTCATCGCATAGATGATTTAGAAA


SUMMARY BY SIMILARITY


Array          Sequence    Position      Length  # Copies  Repeat  Spacer  +  Consensus
=====  ================  ==========  ==========  ========  ======  ======  =  =========
    1  gi|50083297|ref|     2339398         328         6      28      32  +  TTTCTAAGCTGCCTGTGCGGCAGTTAAG
    2  gi|50083297|ref|     2371799        1227        21      28      31  -  TTTCTAAGCTACCTGTGCGGTAGTGAAG
                                                                              ********** ********* *** ***

    3  gi|50083297|ref|     2448115        5428        91      28      32  +  GTTCGTCATCGCATAGATGATTTAGAAA


SUMMARY BY POSITION


>gi|50083297|ref|NC_005966.1| Acinetobacter sp. ADP1, complete genome

Array          Sequence    Position      Length  # Copies  Repeat  Spacer    Distance  Consensus
=====  ================  ==========  ==========  ========  ======  ======  ==========  =========
    1  gi|50083297|ref|     2339398         328         6      28      32              TTTCTAAGCTGCCTGTGCGGCAGTTAAG
    2  gi|50083297|ref|     2371799        1227        21      28      31       32041  CTTCACTACCGCACAGGTAGCTTAGAAA
    3  gi|50083297|ref|     2448115        5428        91      28      32       75058  GTTCGTCATCGCATAGATGATTTAGAAA
How to obtain input file
Seq2CRISPR file
Seq2CRISPR is a standalone tools for identifying CRISPR information from read file, spacer sequence if one of output file. More detail information about the Seq2CRISPR could be seen in the article [5].
The commond for running Seq2CRISPR
python2 Path-to-Seq2CRISPR/Seq2CRISPR.py -1 Path-to-read1-file -2 Path-to-read1-file -r Path-to-repeat-database -o Path-to-result-file
CRISPRFinder file
The CRISPRCasFinder is a webserver which enables the easy detection of CRISPRs and cas genes for bacteria genome file, the spacer sequence could be downloaded from the webserver. More detail information about the CRISPRFinder could be seen in here [6].
PILER-CR file
PILER-CR is a standalone tools for identifying CRISPR information from genome file, the spacer information is one of part of the PILER-CR result. More detail information about the PILER-CR could be seen in the article [7].
The commond for running PILER-CR
pilercr -minarray 1 -in Path-to-bacteria-genome-file -out Path-to-result-file -noinfo -quiet
Method
Three modes are provided for predicting the relationship between bacteria and phage utlizing the CRISPRs analysis.
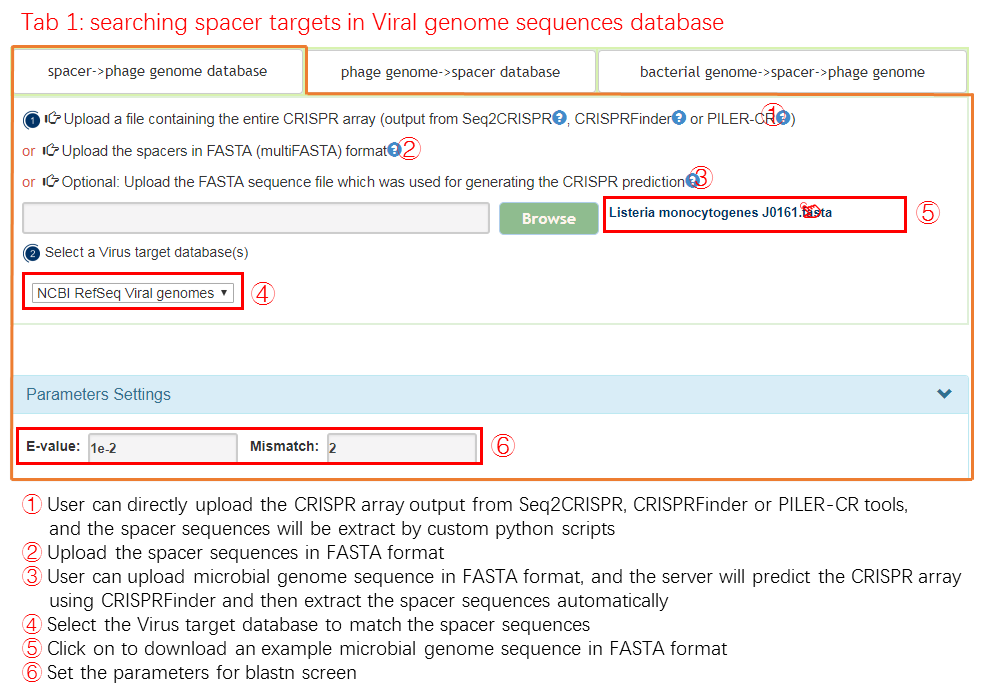
spacer -> phage genome databese
A phage reference database has been built for CRISPRs anlysis, it includes 10230 complete phage genomes from ncbi refSeq database. The best matching phage ,which is obtained by aligning spacer sequence gathered through user input to the phage reference database, is selected as the predicted phage.
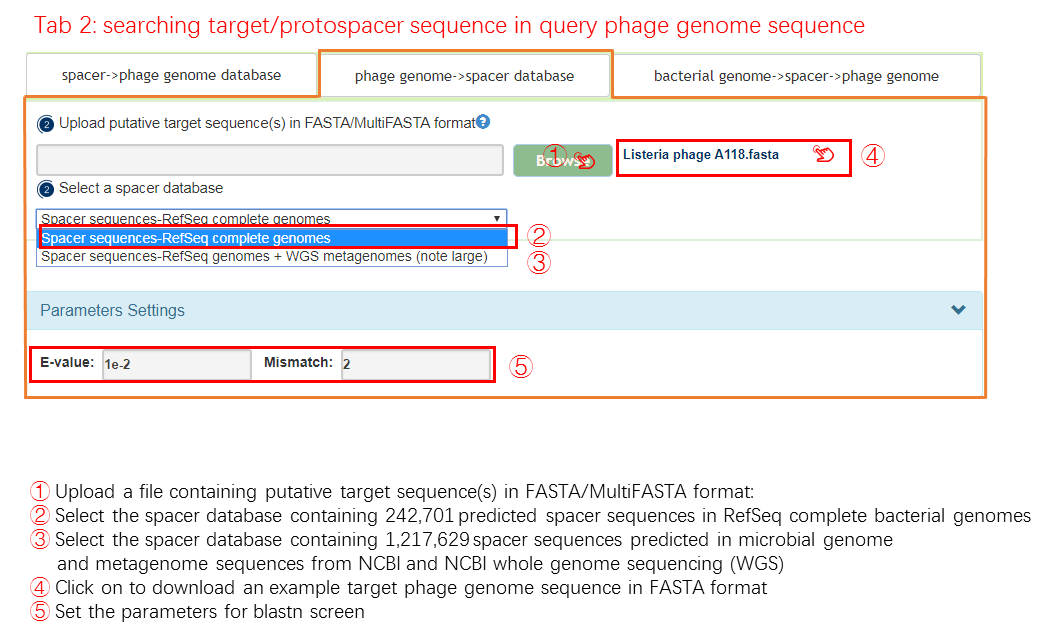
phage genome -> spacer database
Two spacer reference database has been built for CRISPRs anlysis, one is only contains the complete bacteria genomes from NCBI, and the other includes the complete bacteria genomes and WGS bacteria genomes from NCBI. Those spacer sequences could be available from Download page in our webserver. The best matching bacteria, which is obtained by aligning phage sequence gathered through user input to the spacer reference database, is selected as the predicted phage.
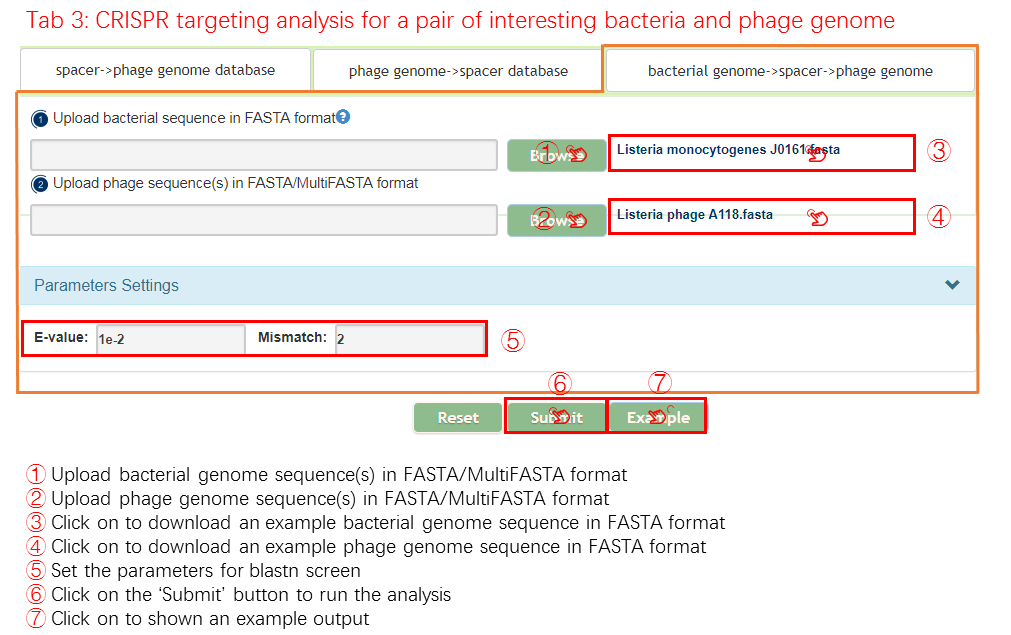
bacteria genome -> spacer -> phage genome
If you need to check a pair of interesting bacteria and pahge using the CRISPRs analysis, this mode will be appropriate. This mode could be devided into two steps.
- Identify the spacer sequence from the bacteria sequence gathered from user input.
- Determine whether the phage could infect the bacteria or not by aligning the identified spacer sequence to the phage sequence.
Input
Output[link to result]
A table contains the detail information of prediction by phage genome -> spacer, the description is shown in the following
| Header | Description |
|---|---|
| Bacterium | The NCBI accession id of the bacteria |
| Spacer_Info | The information of spacer detected from bacteria sequence |
| Hit_ID | The NCBI accession id of the hit phage |
| Hit_Def | The definiton information of the hit phage |
| Identity | The identity value of the predicted relationship through best-matching phage by BLASTN |
| E-value | The E-value of the predicted relationship through best-matching phage by BLASTN |
| Mismatch | The number of mismatch of the predicted relationship through best-matching phage by BLASTN |
| Detail_Info | The detail information of all homologs by BLASTP. |
Output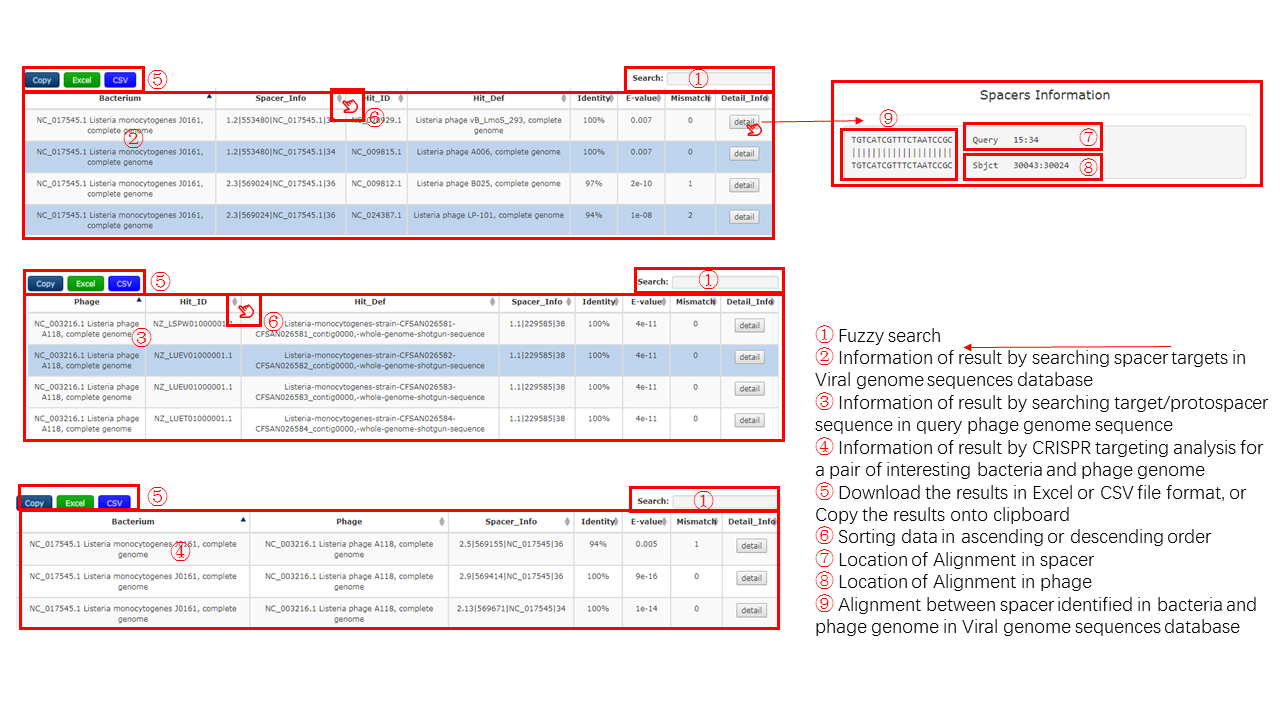
Methods
Identifying relationship between bacteria and phage is based on the phenomenon that many phages insert their genomes into that of their hosts, the integrated phages are known as prophages. There are two key steps for prediction using prophage analysis. The first step is to identify the prophage region in the bacteria genome, and the second step is to annotate the prophage region using BLASTN or BLASTP method by checking the similarity of DNA or protein sequence between the prophage region and Uniprot virus genomes.
Identify prophage region
VirSorter
VirSorter identify the prophage region by utilizing the leveraging probabilistic models, it bases on two reference database, RefSeqABVir and Viromes. VirSorter could fit not only the complete genome, but fragmented genomic and metagenomic datasets. More detail information about the VirSorter could be seen in the article [8].
Phage_Finder
Phage_Finder detects prophage region in completed bacterial genomes by a heuristic computer program, It uses tab-delimited results from NCBI BLASTALL or WU BLASTP 2.0 [9] searches against a collection of bacteriophage sequences and results from HMMSEARCH [10] analysis of 441 phage-specific hidden Markov models (HMMs) to locate prophage regions. More detail information about the VirSorter could be seen in the article [11].
DBSCAN-SWA
DBSCAN-SWA detects prophage by combining DBSCAN and Sliding Window Algorithm.It uses density-based spatial clustering of applications with noise (DBSCAN) [28] to predict clusters of phage or phage-like genes and uses sliding window algorithm to predict these regions based on these bacterium proteins with enougn proteins that are not predicted in DBSCAN. More detail information about the DBSCAN-SWA could be seen in the article [29].
Annotate phage
Two kinds of selection criteria are used for determining the final prediction.
Criteria 1: Best-Matching phage by BLASTN
A phage reference database has been built for Prophage anlysis, it includes 10230 phage genomes from ncbi refSeq database. The best matching phage obtained by aligning with the phage reference database is selected as the predicted phage.
Criteria 2: Majority Matching taxonomy of phage by BLASTP
A uniprot-phage reference database with taxonomy information has been built for Prophage anlysis, it includes all phage protein from UniprotKB. This criteria determines the predict phage by the viewpoint of taxonomy. The Open Reading Frame(ORF) in prophage region are predicted firstly, then do the alignment between predicted ORF and the uniprot-phage reference, finally, majority matching taxonomy is determined as the final taxonomy.
Input
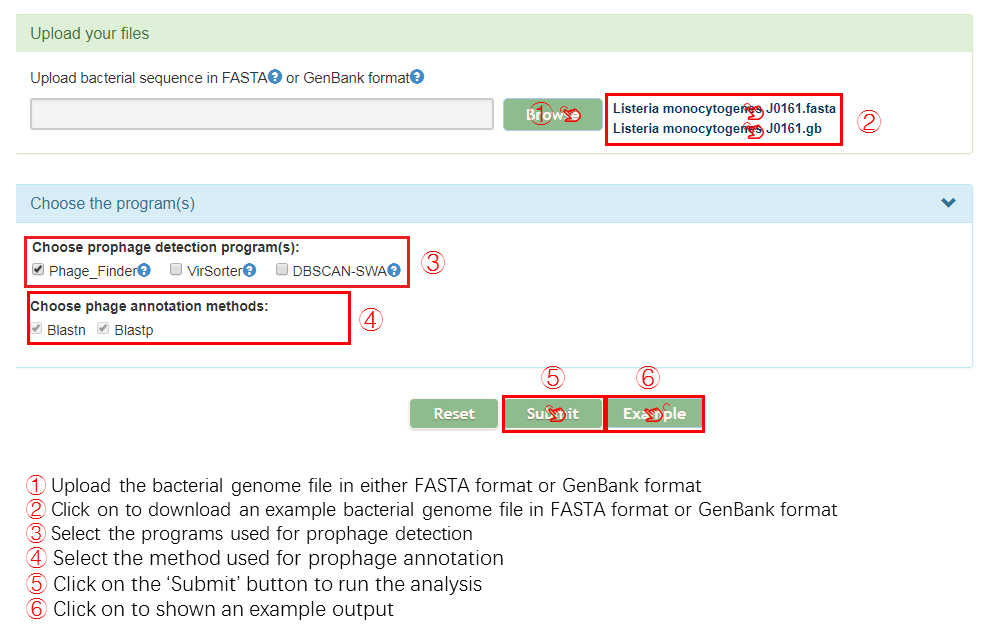
Output[link to result]
A plasmid map is generated to display the prophage region detected by the two individual method, and the integrated region of those two, the prophage region is highlighted by different color.
When you click one prophage region, the detail information, including detected method, location, best-matching phage, and majority matching taxonomy, about this prophage will be display in one text box on the right of the plasmid map.
The table contains the detail information of prediction, the description is shown in the following
| Header | Description |
|---|---|
| Region | Detection method + the number assigned to the region, e.g. DBSCAN-SWA_1 |
| Region Position | The start and end positions of the region on the bacterial chromosome |
| Best matching Phage (BLASTN) | The phage genome with the longest aligned length with the predicted prophage region based on BLASTN searching (default:e-value=1e-10) |
| Best matching Phage(BLASTP) | he phage taxonomy with the most homologous proteins with the predicted prophage region based on BLASTP searching (default:e-value=1e-7) |
| Prophage annotation | Click the detail button to show detail annotation of the prophage region, including Identified phage-like proteins and tRNA sites, and BLASTN matching result of the best hitting phage genome |
When you click the detail button, the detail information of all homologs by BLASTP
Output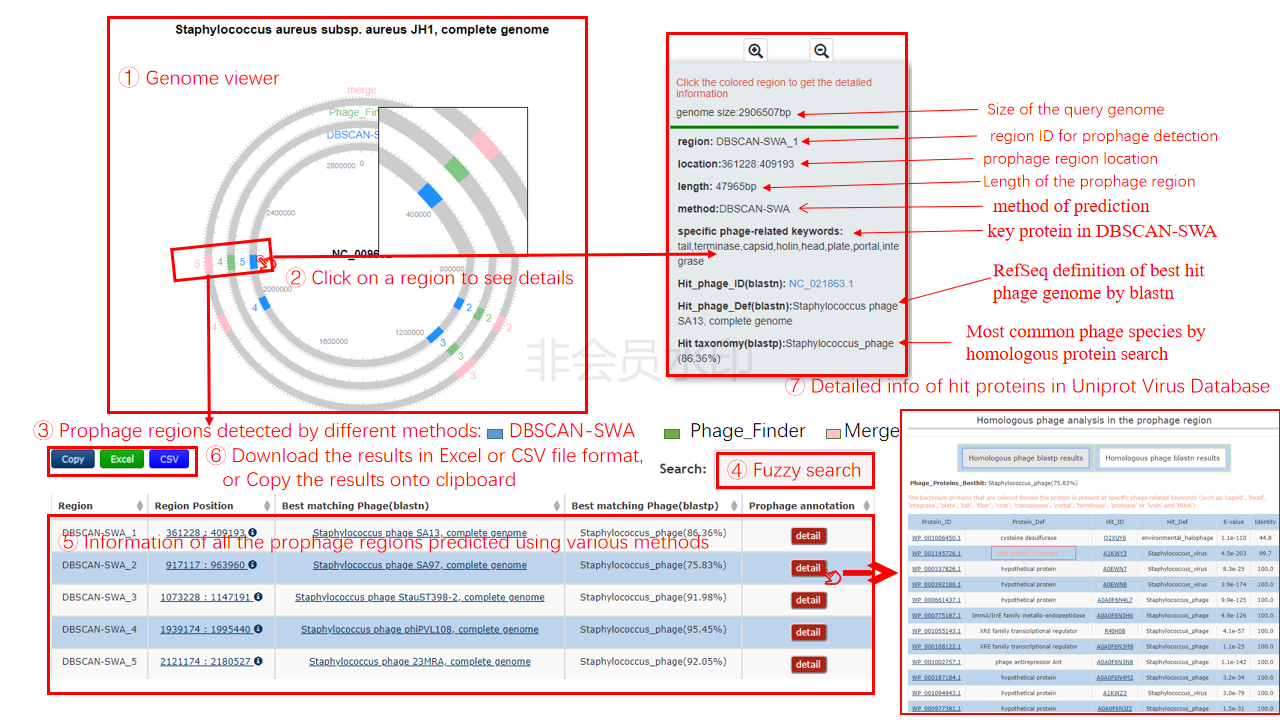
Protein Interaction
Method
Protein Interaction predict the potential bacteria host of bacteriophage from the viewpoint of protein. The protein of bacteria and bacteriophage are assigned to protein families by aligning them to the Pfam database using the Diamond protein alignment algorithm, then the IntAct Molecular Interaction Database[23] is used as the reference data for identifying the interaction between bacteriophage and bacteria.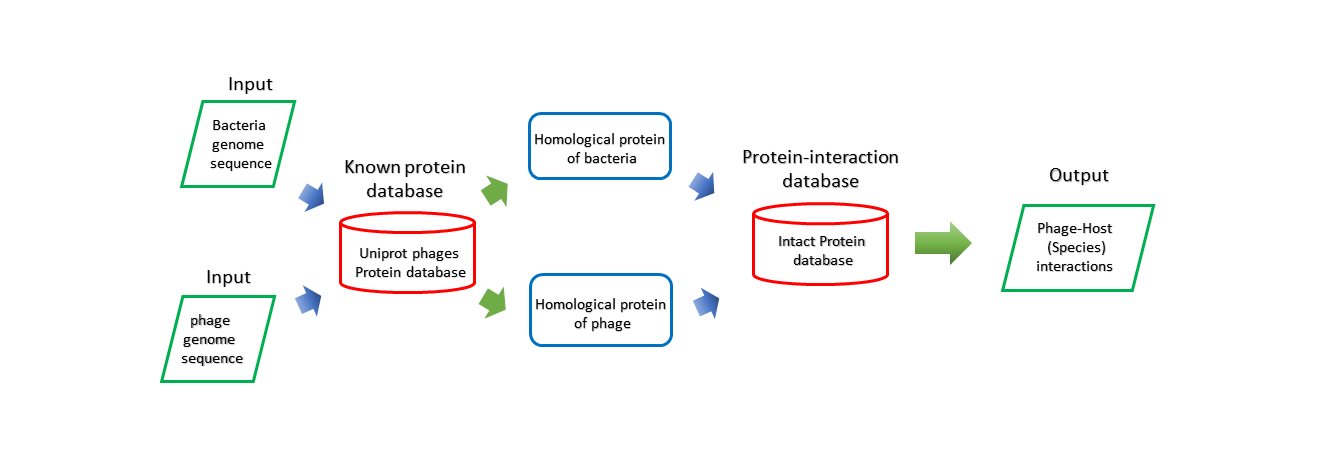
Input
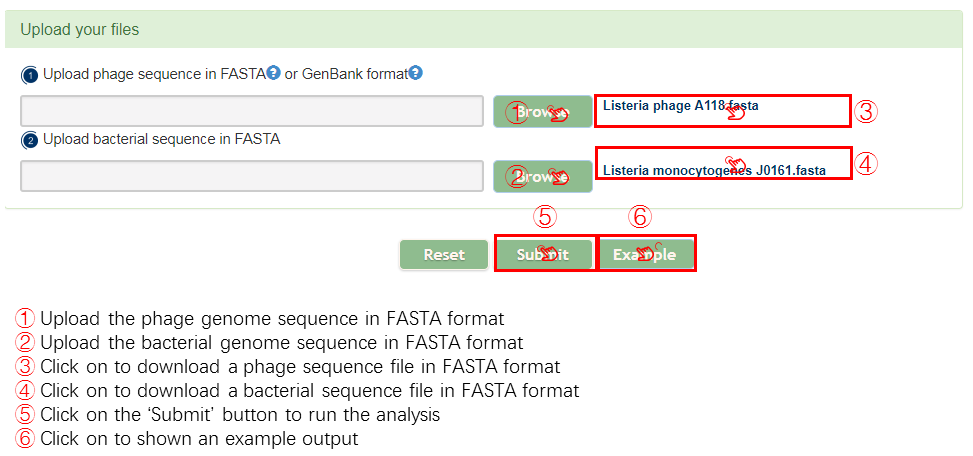
Output[link to result]
A Protein Interaction Network is generated to display the relationship of a pair of bacteria and phage based on the Protein Interaction.
- Green square node represents the protein of query bacterium.
- Pink triangle node represents the protein of query phage.
- Blue line represents that the interaction have been detected between those two protein by one method
- Orange line represents that the interaction have been detected between those two protein by at least two methods
- Green line represents self-interaction
When click one node, the detail information will be displayed beside with the protein interaction network, including the NCBI accession id and definition of the bacterium in which the clicked protein resides, the NCBI accession id, definition and location of Open Reading Frame(ORF) of that protein, and the protein families aligned to the Pfam database
The table contains the detail information of prediction, the description is shown in the following
| Header | Description |
|---|---|
| Bacterium_Protein_ID | The NCBI accession id of the query bacterium |
| Phage_Protein_ID | The NCBI accession id of the query phage |
| Bacterium_Protein_Def | The definiton information of the query bacterium |
| Phage_Protein_Def | The definiton information of the query phage |
| Detection_Method | The method for detecting protein interactions. |
| Interaction_Type | The type for protein interactions. |
Output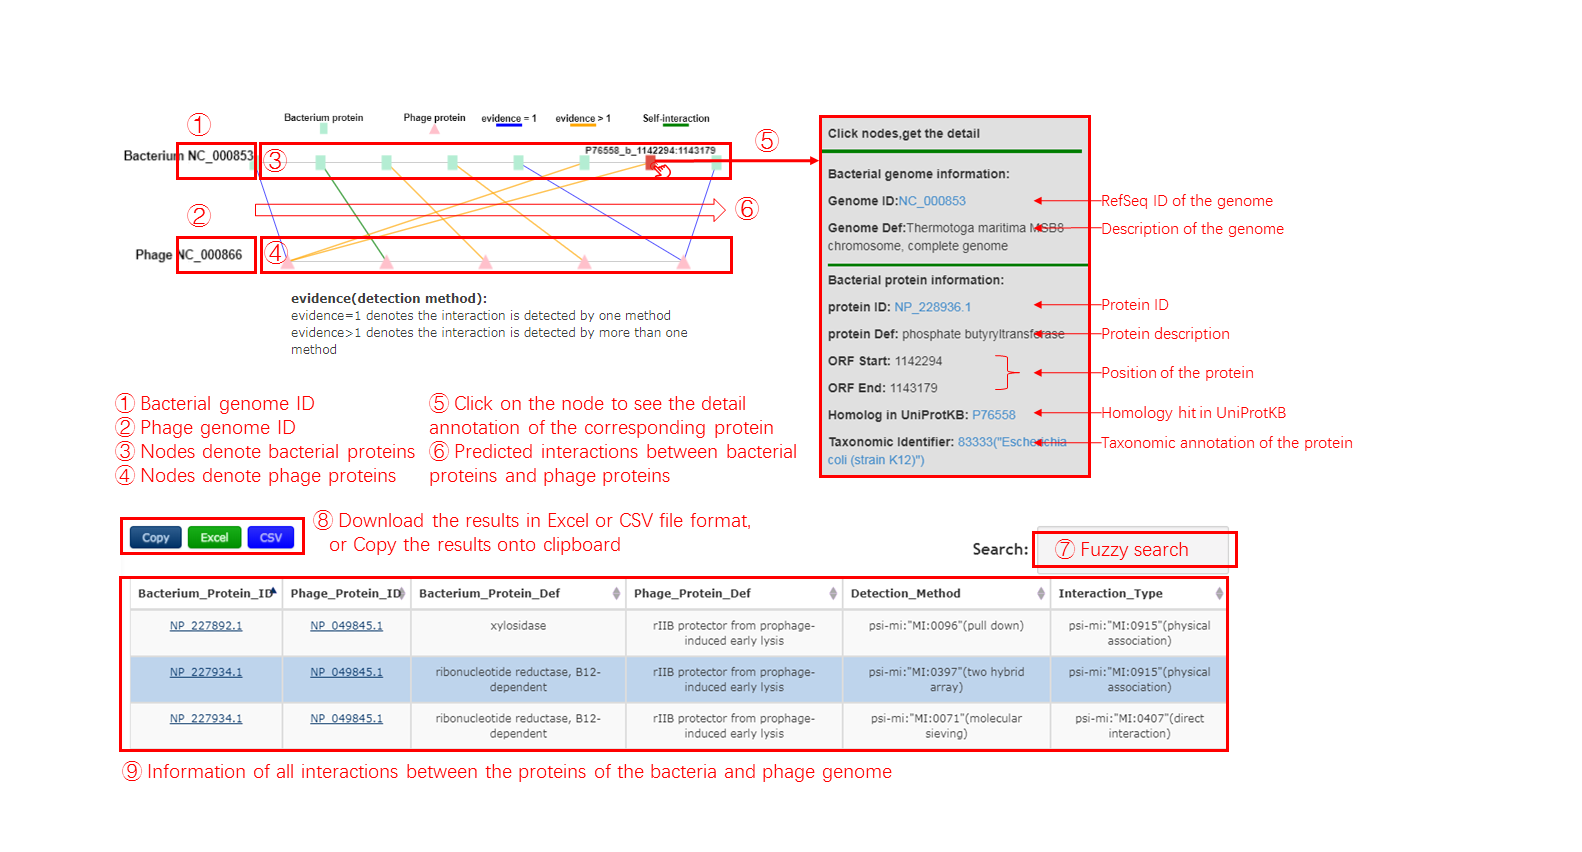
Introduction
Virulence factors(VF)
Virulence factors are molecules produced by bacteria, viruses, fungi, and protozoa that add to their effectiveness and enable them to achieve the following:[17]
- colonization of a niche in the host (this includes attachment to cells)
- immunoevasion, evasion of the host’s immune response
- immunosuppression, inhibition of the host’s immune response
- entry into and exit out of cells (if the pathogen is an intracellular one)
- obtain nutrition from the host
More detail information about virulence factors could be obtained in Wikipedia.
Antibiotic resistance genes(ARGs)
Antimicrobial resistance (AMR or AR) is the ability of a microbe to resist the effects of medication that once could successfully treat the microbe [18]. More detail information about antibiotic resistance genes could be obtained in Wikipedia.
Antibiotic Resistance Ontology (ARO)
The Antibiotic Resistance Ontology describes antibiotic resistance genes and mutations, their products, mechanisms, and associated phenotypes, as well as antibiotics and their molecular targets. It is integrated with the Comprehensive Antibiotic Resistance Database[19], a curated resource containing high quality reference data on the molecular basis of antimicrobial resistance[20].
Method
Specialty gene could be used for identifying the relationship between bacteria and phage due to the phage play a crucial role in transferring specialty gene. Two of important genes among those are virulence factors and antibiotic resistance genes. The virulence factors could be checked by comparing with marker genes using ShortBRED:Short, Better Representative Extract Dataset[21], and the antibiotic resistance genes is obtained through aligning with the Comprehensive Antibiotic Resistance Database(CARD) utilizing Resistance Gene Identifier(RGI)[22].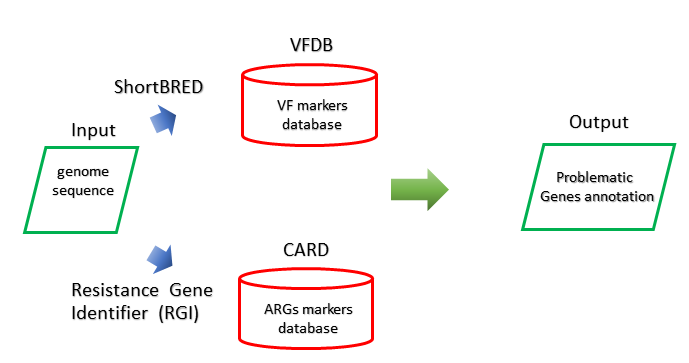
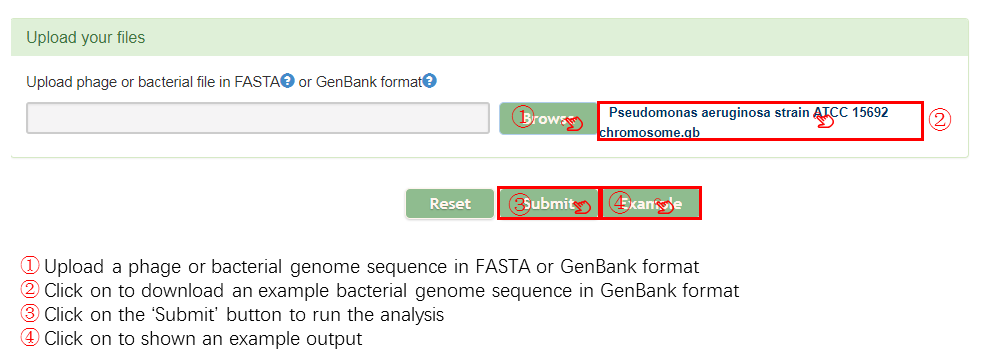
Input
Output[link to result]
A virulence factors table is generated to display the virulence factors of query sequence, the description is shown in the following:
| Header | Description |
|---|---|
| Protein_ID | The NCBI accession identifier of protein belongs to the query sequence |
| Protein_Def | The definiton information of protein belongs to the query sequence |
| Protein_Location | The location information of protein belongs to the query sequence |
| VFDB_Hit_ID | The id of homology in for query protein virulence factors database information of the query phage |
| VFDB_Hit_Def | The definiton of homology in for query protein virulence factors database information of the query phage |
The antibiotic resistance genes table is generated to display the antibiotic resistance genes of query sequence, the description is shown in the following:
| Header | Description |
|---|---|
| Protein_ID | The identifier of protein belongs to the query sequence |
| Protein_Def | The definiton of protein belongs to the query sequence |
| Best_Hit_ARO | ARO term of top hit in CARD |
| AMR_Gene_Family | ARO Categorization |
| Resistance_Mechanism | ARO Categorization |
| Drug_Class | ARO Categorization. |
Output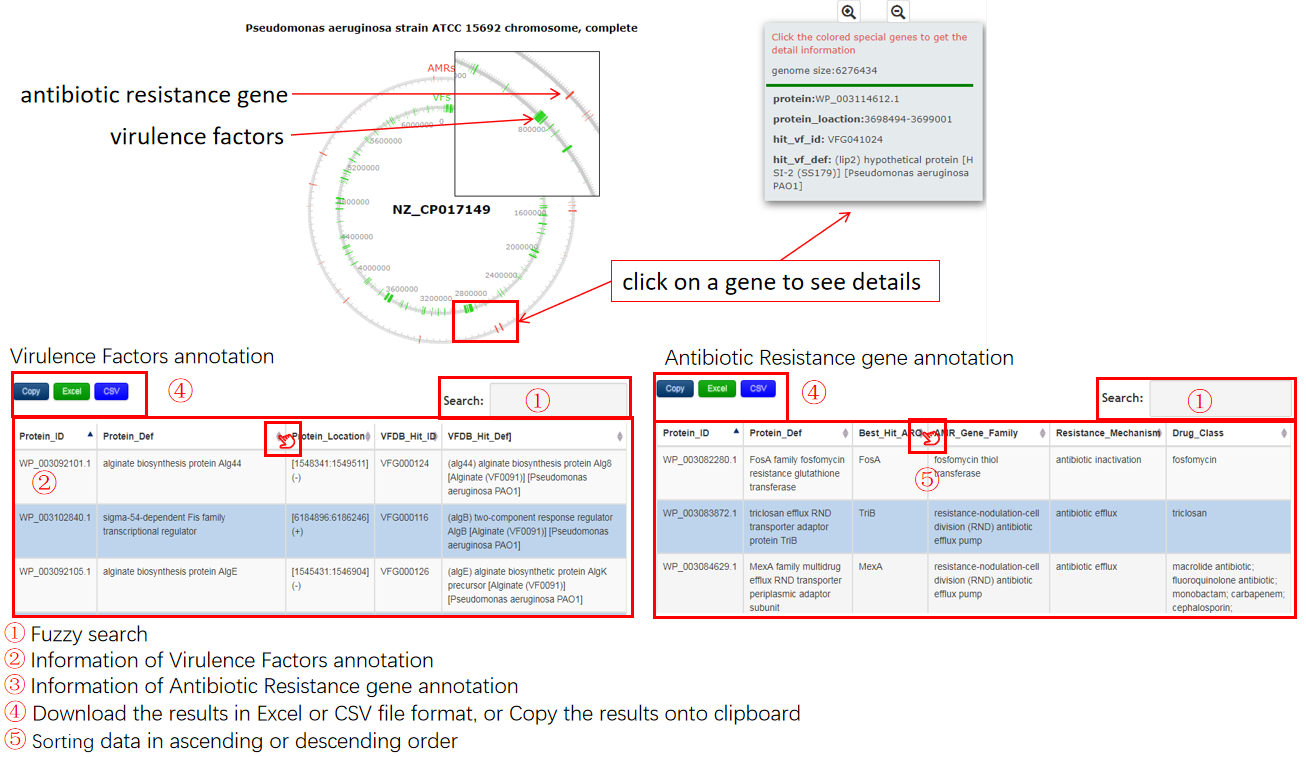
File format
FASTA format
Definiton
FASTA format is a text-based format for representing either nucleotide sequences or peptide sequences, in which nucleotides or amino acids are represented using single-letter codes[12,13].
A FASTA format sequence starts with a single comment line and is followed by sequence lines. A greater-than (“>”) symbol is used before the first character of the comment line to distinguish it from sequence lines.
Example
>Dnmt3a partial sequence
ACTCCCCGTGCGCGCCCGGCCCGTAGCGTCCTCGTCGCCGCCCCTCGTCTCGCAGCCGCAGCCCGCGTGG
ACGCTCTCGCCTGAGCGCCGCGGACTAGCCCGGGTGGCCCACTGGCGCGCGGGCGAGCGCACGGGCGCTC
CAGTCCGGCAGCGCCGGGGTTAAGCGGCCCAAGTAAACGTAGCGCAGCGATCGGCGCCGGAGATTCGCGA
ACCCGACACTCCGCGCCGCCCGCCGGCCAGGACCCGCGGCGCGATCGCGGCGCCGCGCTACAGCCAGCCT
CACGACAGGCCCGCTGAGGCTTGTGCCAGACCTTGGAAACCTCAGGTATATACCTTTCCAGACGCGGGAT
CTCCCCTCCCCCATCCATAGTGCCTTGGGACCAAATCCAGGGCCTTCTTTCAGGAAACAATGAAGGGAGA
CAGCAGACATCTGAATGAAGAAGAGGGTGCCAGCGGGTATGAGGAGTGCATTATCGTTAATGGGAACTTC
AGTGACCAGTCCTCAGACACGAAGGATGCTCCCTCACCCCCAGTCTTGGAGGCAATCTGCACAGAGCCAG
TCTGCACACC
GenBank(full) format
Definiton
The GenBank(full) format file contains many biological features of the record, including Locus line, sequence length, molecule type, record definition, accession id and others[14].
The GenBank(full) format (GenBank Flat File Format) consists of an annotation section and a sequence section. The start of the annotation section is marked by a line beginning with the word “LOCUS”. The start of sequence section is marked by a line beginning with the word “ORIGIN” and the end of the section is marked by a line with only “//“.
Example
The Genbank format is a plain text format which looks like this:
LOCUS       EU490707                1302 bp    DNA     linear   PLN 05-MAY-2008
DEFINITION  Selenipedium aequinoctiale maturase K (matK) gene, partial cds;
            chloroplast.
ACCESSION   EU490707
VERSION     EU490707.1  GI:186972394
KEYWORDS    .
SOURCE      chloroplast Selenipedium aequinoctiale
  ORGANISM  Selenipedium aequinoctiale
            Eukaryota; Viridiplantae; Streptophyta; Embryophyta; Tracheophyta;
            Spermatophyta; Magnoliophyta; Liliopsida; Asparagales; Orchidaceae;
            Cypripedioideae; Selenipedium.
REFERENCE   1  (bases 1 to 1302)
  AUTHORS   Neubig,K.M., Whitten,W.M., Carlsward,B.S., Blanco,M.A.,
            Endara,C.L., Williams,N.H. and Moore,M.J.
  TITLE     Phylogenetic utility of ycf1 in orchids
  JOURNAL   Unpublished
REFERENCE   2  (bases 1 to 1302)
  AUTHORS   Neubig,K.M., Whitten,W.M., Carlsward,B.S., Blanco,M.A.,
            Endara,C.L., Williams,N.H. and Moore,M.J.
  TITLE     Direct Submission
  JOURNAL   Submitted (14-FEB-2008) Department of Botany, University of
            Florida, 220 Bartram Hall, Gainesville, FL 32611-8526, USA
FEATURES             Location/Qualifiers
     source          1..1302
                     /organism="Selenipedium aequinoctiale"
                     /organelle="plastid:chloroplast"
                     /mol_type="genomic DNA"
                     /specimen_voucher="FLAS:Blanco 2475"
                     /db_xref="taxon:256374"
     gene            <1..>1302
                     /gene="matK"
     CDS             <1..>1302
                     /gene="matK"
                     /codon_start=1
                     /transl_table=11
                     /product="maturase K"
                     /protein_id="ACC99456.1"
                     /db_xref="GI:186972395"
                     /translation="IFYEPVEIFGYDNKSSLVLVKRLITRMYQQNFLISSVNDSNQKG
                     FWGHKHFFSSHFSSQMVSEGFGVILEIPFSSQLVSSLEEKKIPKYQNLRSIHSIFPFL
                     EDKFLHLNYVSDLLIPHPIHLEILVQILQCRIKDVPSLHLLRLLFHEYHNLNSLITSK
                     KFIYAFSKRKKRFLWLLYNSYVYECEYLFQFLRKQSSYLRSTSSGVFLERTHLYVKIE
                     HLLVVCCNSFQRILCFLKDPFMHYVRYQGKAILASKGTLILMKKWKFHLVNFWQSYFH
                     FWSQPYRIHIKQLSNYSFSFLGYFSSVLENHLVVRNQMLENSFIINLLTKKFDTIAPV
                     ISLIGSLSKAQFCTVLGHPISKPIWTDFSDSDILDRFCRICRNLCRYHSGSSKKQVLY
                     RIKYILRLSCARTLARKHKSTVRTFMRRLGSGLLEEFFMEEE"
ORIGIN
        1 attttttacg aacctgtgga aatttttggt tatgacaata aatctagttt agtacttgtg
       61 aaacgtttaa ttactcgaat gtatcaacag aattttttga tttcttcggt taatgattct
      121 aaccaaaaag gattttgggg gcacaagcat tttttttctt ctcatttttc ttctcaaatg
      181 gtatcagaag gttttggagt cattctggaa attccattct cgtcgcaatt agtatcttct
      241 cttgaagaaa aaaaaatacc aaaatatcag aatttacgat ctattcattc aatatttccc
      301 tttttagaag acaaattttt acatttgaat tatgtgtcag atctactaat accccatccc
      361 atccatctgg aaatcttggt tcaaatcctt caatgccgga tcaaggatgt tccttctttg
      421 catttattgc gattgctttt ccacgaatat cataatttga atagtctcat tacttcaaag
      481 aaattcattt acgccttttc aaaaagaaag aaaagattcc tttggttact atataattct
      541 tatgtatatg aatgcgaata tctattccag tttcttcgta aacagtcttc ttatttacga
      601 tcaacatctt ctggagtctt tcttgagcga acacatttat atgtaaaaat agaacatctt
      661 ctagtagtgt gttgtaattc ttttcagagg atcctatgct ttctcaagga tcctttcatg
      721 cattatgttc gatatcaagg aaaagcaatt ctggcttcaa agggaactct tattctgatg
      781 aagaaatgga aatttcatct tgtgaatttt tggcaatctt attttcactt ttggtctcaa
      841 ccgtatagga ttcatataaa gcaattatcc aactattcct tctcttttct ggggtatttt
      901 tcaagtgtac tagaaaatca tttggtagta agaaatcaaa tgctagagaa ttcatttata
      961 ataaatcttc tgactaagaa attcgatacc atagccccag ttatttctct tattggatca
     1021 ttgtcgaaag ctcaattttg tactgtattg ggtcatccta ttagtaaacc gatctggacc
     1081 gatttctcgg attctgatat tcttgatcga ttttgccgga tatgtagaaa tctttgtcgt
     1141 tatcacagcg gatcctcaaa aaaacaggtt ttgtatcgta taaaatatat acttcgactt
     1201 tcgtgtgcta gaactttggc acggaaacat aaaagtacag tacgcacttt tatgcgaaga
     1261 ttaggttcgg gattattaga agaattcttt atggaagaag aa
//
note:
GenBank(full) format file is recommended as the inputfile due to the GenBank(full) contains the whole annotation information.
Method
HostPhinder
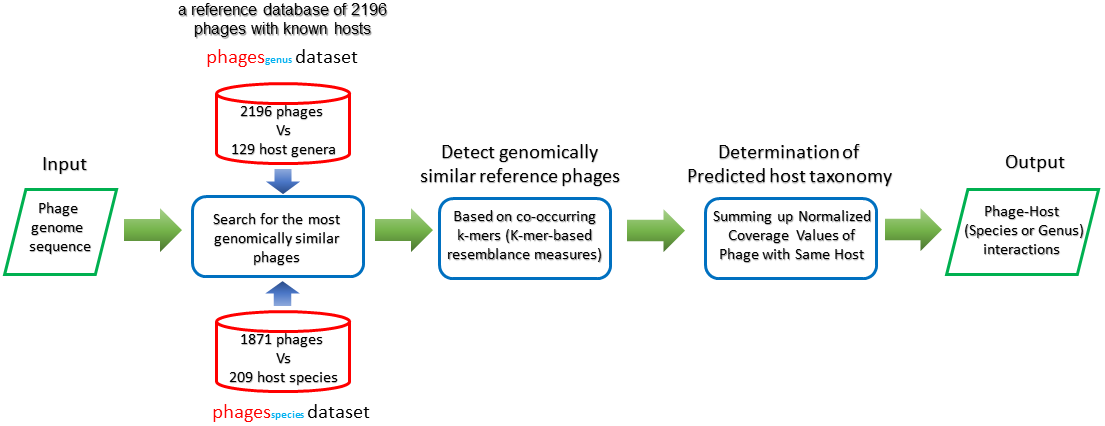
HostPhinder[15] predict bacteria host of bacteriophage by examing the similiarty of input bacteriophage among the database which contains the bacteriophage with known hosts. We use a reference database of 2196 bacteriophage with known host, that database is divided into two dataset according to taxon further, Therefore our pipeline could predict the bacteria host of bacteriophage from two taxonomic level, species and genus.
GeneNet
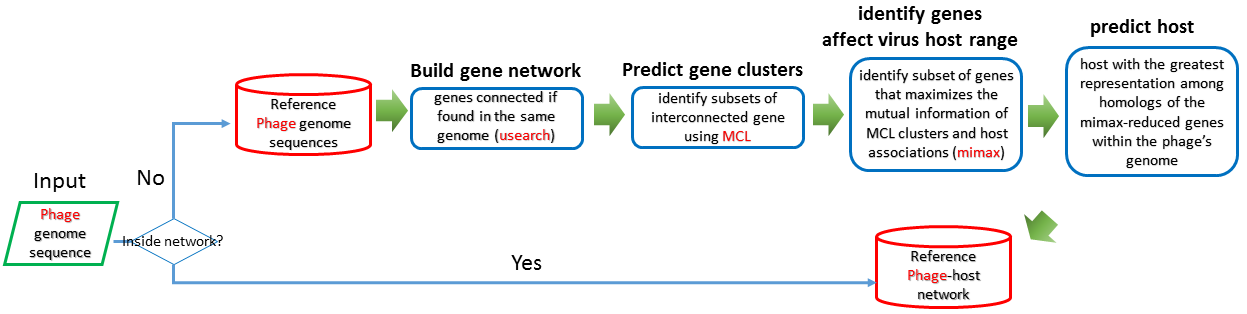
GeneNet[16] offer both a high-resolution view of viral genetic diversity and a means to connect specific groups of genes to broad patterns in viral ecology and evolution through gene level networks. A reference phage-host network has been built previously, if the query phage is in the network, the bacterial host can be obtained immediately. Otherwise, the workflow of predicting the bacterial host as following flowchar.
Input
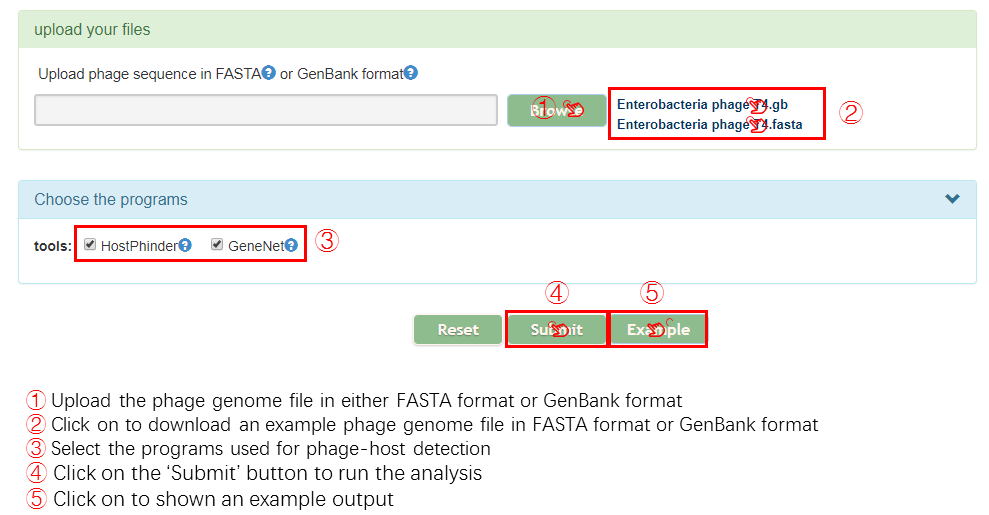
Output[link to result]
HostPhinder
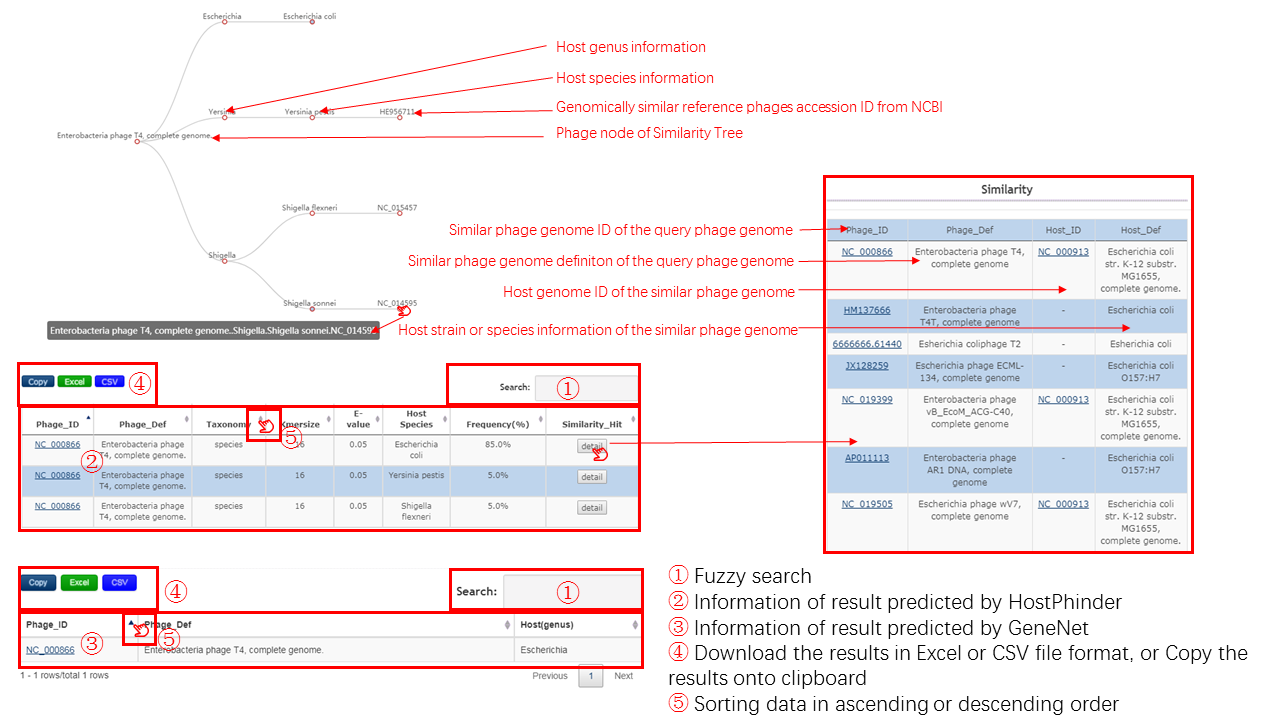
A tree is generated to display the relationship of a pair of bacteria and bacteriophage based on the similarity detected by HostPhinder, and the detailed information can be viewed in the correspoonding table.
The construction of tree is based on the taxonomic level information of bacteriophage and potential bacteria host, and the displayed information can be unfold or fold by clicking the red node.
- Root node of tree is the query bacteriophage
- Leaf nodes represent the potential bacteria host detected by similarity
- Internal node is the taxonomic level information about the potential bacteria host
The table contains the detail information of prediction by HostPhinder, the description is shown in the following
| header | Description |
|---|---|
| Phage_ID | The accession id from NCBI of query bacteriophage |
| Phage_Def | The definition information of query bacteriophage |
| Taxonomy | The taxonomic level information of potential bacteria host, the value is genus or species |
| Kmersize | The length of k-mer used for searching potential bacteria host by similarity |
| Evalue | The e-value used for searching potential bacteria host by similarity |
| Host_Species | The species information of the potential bacteria host |
| Frequency(%) | The frequency of the bacteria host among the whole searching result |
GeneNet
GeneNet Table
The table contains the detail information of prediction by GeneNet, the description is shown in the following.
| header | Description |
|---|---|
| Phage_ID | The accession id from NCBI of query bacteriophage |
| Phage_Def | The definition information of query bacteriophage |
| Host(Genus) | The taxonomic level information of potential bacteria host, the value is genus |
Output
Abundance file format
Definition
Abundance file is a text-based format file for recording the abudance of microbe in metagenome. Abundance file consists of definition section and abundance value section. The first line of file is the definition line, which includes the sample infomation. The remaining part is the specifiec abundance value of per microbe detected from samples. One line for one microbial abundance and abundance values are tab delimited.
Example
Taxa    MG100507    MG100513    MG100519    MG100525
Acinetobacter    0.0010827    0    0    0.009929199
Actinomyces    0.005781299    0.0032187    0    0
Aerococcus    4.09E-05    0    0    0
Aggregatibacter    4.69E-05    0    0    0
How to obtain abundance file from Read files
Obtain the abundance file from Read files is crucial for Co-occurrence/Co-abundance analysis, here is a tutorial for getting abundance file, more detail could be seen in [1]
Step1: Pre-Processing Samples
The original samples data are need to pre-processing, including adapter trimming, quality trimming, and decontamination. If these processing have been done in your reads data, you could skip this step.
Adapter Trimming
Reads generated by the MiSeq were adapter trimmed, nevertheless reads from the HiSeq were not. Therefore, some samples need adapter trimmed through the program cutadapt.
cutadapt --error-rate=0.1 --overlap=10 -a adapter_ligated_to_the_3'_end -g adapter_ligated_to_the_5'_end > path_to_adapter_trimmed_dirctory
Quality Trimming
Adapter trimmed sequences were quality trimmed using fastx_toolkit-0.0.14 to remove sequences with a quality score < 33.
fastq_quality_trimmer -t 33 -i path_to_adapter_trimmed_file.fastq path_to_quality_trimmed_file.fastq
Decontamination
Standalone DeconSeq is used for removing the contaminants from sequences.
perl deconseq-standalone-0.4.3/deconseq.pl -f path_to_quality_trimmed_file.fastq -dbs name_of_remove_database(s) -out_dir ./deconseq_fastq/
Step2: Contig Assembly
Contigs were assembled using the program Ray.
First, convert the fastq files into fasta files and run the Ray assembler.
mpiexec -n 25 Ray-2.3.1/Ray -minimum-contig-length 500 -p path_to_file1.fasta path_to_file2.fasta -o path_to_ray_output_dirctory
Step3: Open Reading Frame Prediction
After the contigs were generated from the concatenated fasta files, we predicted the locations of the open reading frames (ORFs) and extracted them from the contigs using the Glimmer3 toolkit.
# Perform glimmer extraction
build-icm Path_to/Contigs.icm < Path_to/Contigs.fasta
# Predict ORF
glimmer3 -g 100 Contigs.fasta Path_to/Contigs.icm/Contigs.icm Path_to/glimmer_output
Step4: Assiging Taxonomy and Get Relative Abundance Table
Identify bacteria, virus taxonomy within UniProt reference database.
Establish Uniprot Virus Database
# Download the entire Uniprot TrEMBL reference fasta database
wget ftp://ftp.uniprot.org/pub/databases/uniprot/current_release/knowledgebase/complete/uniprot_trembl.fasta.gz
# Download the entire Uniprot TrEMBL reference fasta database
wget ftp://ftp.uniprot.org/pub/databases/uniprot/current_release/knowledgebase/complete/uniprot_trembl.fasta.gz
# Generate blast database from the uniprot references (virus+phage)
makeblastdb -dbtype prot -in uniprot_phage_virus_TrEMBL.fa -out uniprot_virus_and_phage_TrEMBL_db
Assign Taxonomy
bash Assiging_Taxonomy.bash
Get a relative abundance table
bash Get_Relative_Abundance.bash
Method
Co-occurrences and mutual exclusions are computed by CoNet[2] according to a pair of the abundance file.
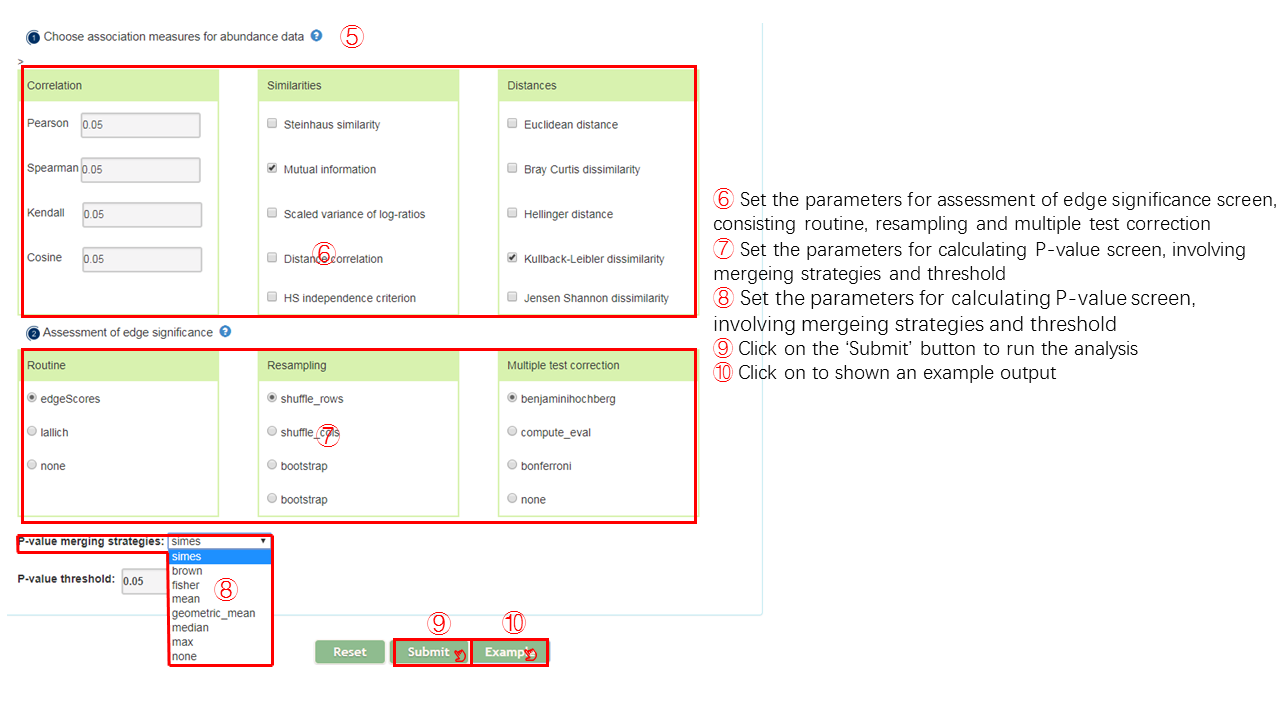
The Co-abundance analysis is divided into two steps, permutations and bootstraps.
In permutations step, users need to specify the association measures for abundance data. The measures mainly consist three aspects, correlation, similarity and distance. In detail, several measures could be chosen for each aspect.User could choose the appropriate measure according to own need. The default parameters are Pearson, Spearman, Mutual information, Bray Curtis dissimilarity and Kullback-Leibler dissimilarity. A intermediate network will be created on the basis of result of permutations.
In bootstraps step, user could choose the parameters, including method for routine,resampling,multiple test, p-value merge stragegies.The default parameters are edgeScores, bootstrap, benjaminihochberg and simes.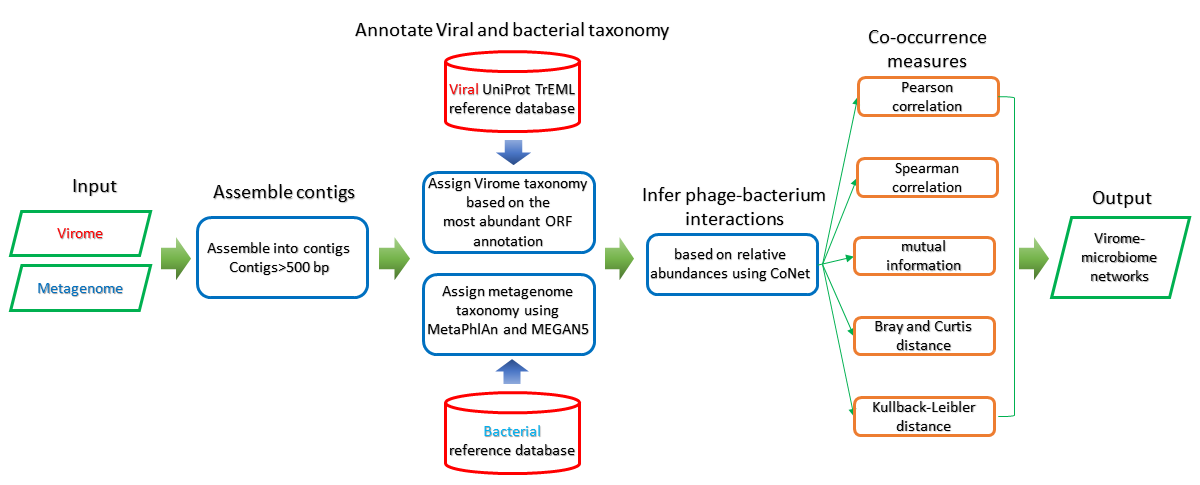
Input
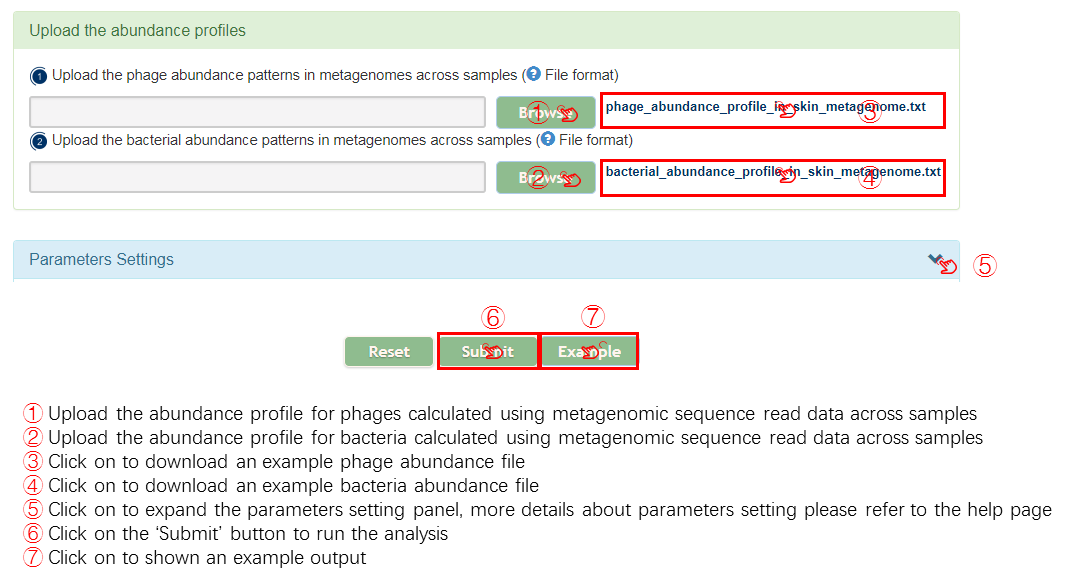
Output[link to result]
6 networks are generated to display the relationship of a pair of bacteria and bacteriophage based on the co-occurrence/co-abundance, and the detailed information can be viewed in the correspoonding table. Specifically, there are one overall network and five single-measure networks. The overall network considers five association measures comprehensively aimming at interpreting the relationship as a whole, and each of the remaining network represents one specific assocation measures.
- Bacteria and bacteriophage in the network are represented as the corresponding cartoon image.
- The red lines indicate a negative correlation which means the mutual exclusion relationship between bacteria and bacteriophage
- The blue lines imply a positive correlation which signifies the co-occurrence or co-abundance relationship.
- Detailed information including interaction type and score of association measure is shown in the table below the network, you could check related information if you are interested in those.
note:
The overall network is an overview of the relationship between bacteria and bacteriophage, it is not reasonable to set the color of edges due to the correlation between bacteria and bacteriophage may be different under different measures
Output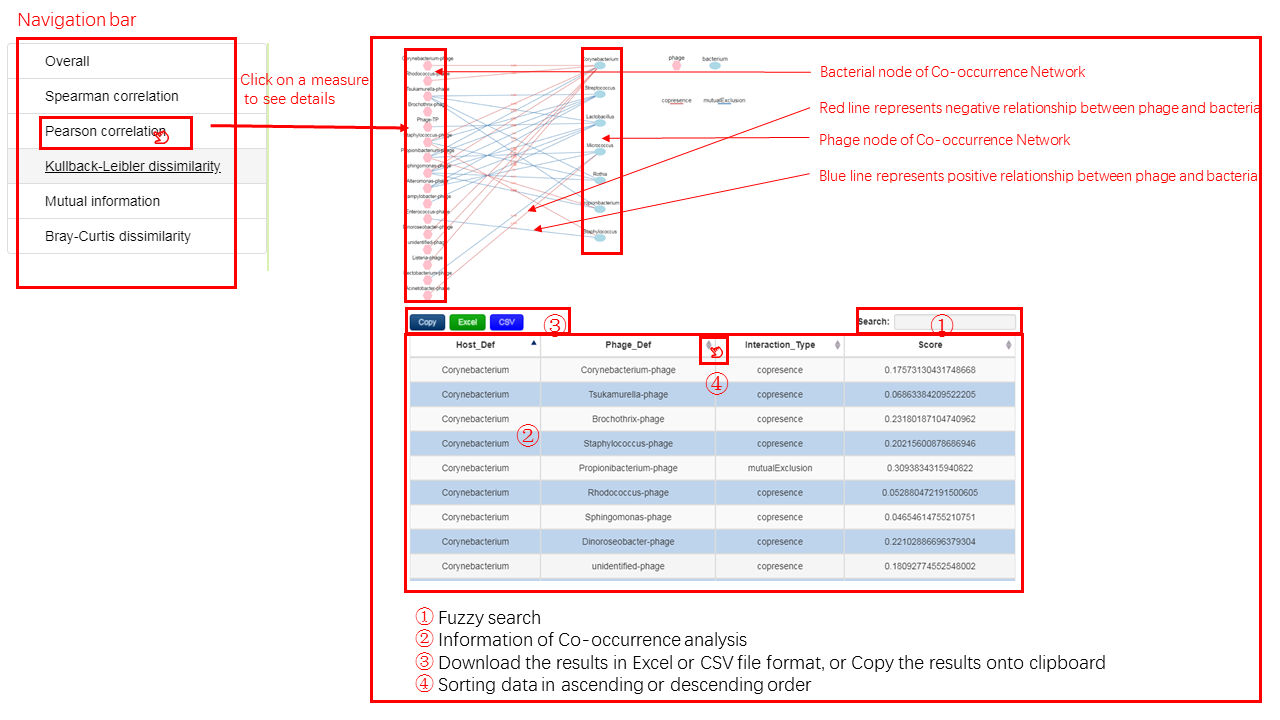
Introduction
NCBI Pathogen Detection (https://www.ncbi.nlm.nih.gov/pathogens/isolates/) integrates bacterial pathogen genomic sequences originating in food, environmental sources, and patients. 368 clinical isolates (31 species) from human submitted in 2020, which have complete bacterial genome sequences and predicted AMR genotypes were collected for infecting phages prediction using PHISDetector. Finally, reliable infecting phages for 315 bacterial isolates (85.6%) from 21 species (67.7%) were obtained.
Output[link to result]
Introduction
454 bacteria isolates from human gastrointestinal tract that have completed sequencing and annotation were collected from https://www.hmpdacc.org/hmp/HMRGD/. Candidate phages for 135 bacteria from 55 species were predicted using PHISDetector with high reliability. These interactions provided potential tools for precise manipulation of specific microbes in human gut, benefit for studying the function of intestinal symbiotic bacteria or developing therapies for treating pathogenic bacteria.
Output[link to result]
Introduction
We have collected bacteria genomes with prophage regions, those prophage regions are identified by PHASTER, VirSorter and Prophinder respectively, those data are available for download in our website.
We process the prophage region futher to obtain an integrated file containing prophage region information, the processing criterion for each bacteria is as follows.
- Retain one prophage region if multiple methods identify the same prophage region, but the method for identifying are all reserved.
- Merge prophage region if there exists overlap between regions of the prophage identified by multiple methods.
Then, we predict the potential phage of the bacteria according to the dna and protein sequence in prophage, two kinds of selection criteria are used for determining the final prediction.
- Best-Matching phage by BLASTN. The dna sequences are aligned to the NCBI phage database built by ourselves, and the best matching phage is selected as the predicted phage.
- Majority Matching taxonomy of phage by BLASTP. The protein sequences are aligned to the UniprotKB virus database built by ourselves, and the majority matching taxonomy of alignment result is determined as the final taxonomy.
Output[link to result]
The results of prophages analysis are shown in a data sheet with a total of 3,641 results.
- The results can be browsed in lexicographical order of the generic information
- Details of the each prophage of bacteria can be obtained by clicking the view button
- A detailed description of the meanings of the results can be refered by Help page
Antibiotic resistance in human pathogenic bacteria has been becoming a threat to public health in the recent years, phage therapy is one of the alternatives to antibiotics. This case demonstrates the result of analysis about the two phage cocktail used as phage therapy.
Georgian Bacteriophage Cocktail
Introduction of Georgian Bacteriophage Cocktail
Georgian Bacteriophage Cocktail is the longest-used commercial phage cocktail in the world, and it is still routinely employed for human therapy in the Republic of Georgia. That bacteriophage cocktail was created as a multi-component treatment and prophylaxis of intestinal infections.
The Georgian Bacteriophage Cocktail preparation is a combination of phage active against Shigella, Escherichia, Salmonella, Enterococcus, Staphylococcus, Streptococcus and Pseudomonas.Intestibacteriophage is used for treatment and prophylaxis of the following bacterial intestinal infections caused by the above mentioned microorganisms: dysentery, salmonellosis, dyspepsia, colitis, enterocolitis, and dysbacteriosis (bacterial overgrowth)
Composition of Georgian Bacteriophage Cocktail
The phage used in Georgian Bacteriophage Cocktail are listed in the below table. More detail can be seen in [24].
| Phage_ID | Description |
|---|---|
| KC012913.1 | Staphylococcus phage Team1, complete genome |
| AY954969.1 | Bacteriophage G1, complete genome |
| JX415536.1 | Escherichia phage ECBP2, complete genome |
| KC862301.1 | Pseudomonas phage PAK_P5, complete genome |
| KF562340.1 | Escherichia phage vB_EcoP_PhAPEC7, complete genome |
| FR775895.2 | Enterobacteria phage phi92, complete genome |
| AB609718.1 | Enterococcus phage phiEF24C-P2 DNA, complete genome |
| KJ094032.2 | Enterococcus phage VD13, complete genome |
| HM035024.1 | Shigella phage Shfl1, complete genome |
| EU734172.1 | Enterobacteria phage EcoDS1, complete genome |
| KJ190158.1 | Escherichia phage vB_EcoM_FFH2, complete genome |
| DQ832317.1 | Escherichia coli bacteriophage rv5, complete sequence |
| JX094499.1 | Enterobacteria phage Chi, complete genome |
| KC139512.1 | Salmonella phage FSL SP-088, complete genome |
| KJ010489.1 | Enterococcus phage IME-EFm1, complete genome |
| GU070616.1 | Salmonella phage PVP-SE1, complete genome |
| JX128259.1 | Escherichia phage ECML-134, complete genome |
| DQ904452.1 | Bacteriophage RB32, complete genome |
| GQ468526.1 | Enterobacteria phage 285P, complete genome |
| FJ194439.1 | Kluyvera phage Kvp1, complete sequence |
| KM233151.1 | Enterobacteria phage EK99P-1, complete genome |
| JX865427.2 | Enterobacteria phage JL1, complete genome |
| AY370674.1 | Enterobacteria phage K1-5, complete genome |
| HE775250.1 | Salmonella phage vB_SenS-Ent1 complete genome |
| JX202565.1 | Salmonella phage wksl3, complete genome |
| HG518155.1 | Pseudomonas phage TL, complete genome |
| AM910650.1 | Pseudomonas phage LUZ24, complete genome |
| EU877232.1 | Enterobacteria phage WV8, complete sequence |
| HQ665011.1 | Escherichia phage bV_EcoS_AKFV33, complete genome |
| AY543070.1 | Bacteriophage T5, complete genome |
| EF437941.1 | Enterobacteria phage Phi1, complete genome |
Analysis of Georgian Bacteriophage Cocktail
Data of Georgian Bacteriophage Cocktail was analysed based on the Similarity analysis. HostPhinder and GeneNet are used for identifying the bacteria host of those bacteriophage in Georgian Bacteriophage Cocktail. All the bacteria hosts except for Streptococcus are predicted on the basis of genus level.
The commercial phage cocktail ColiProteus
Introduction of phage cocktail ColiProteus
The Microgen ColiProteus phage preparation is a combination of phage targeting Escherichia coli/Proteus from the Russian pharmaceutical company Microgen infection
Composition of phage cocktail ColiProteus
The phage used in phage cocktail ColiProteus are listed in the below table. More detail can be seen in [25].
| Phage_ID | Description |
|---|---|
| NC_000866 | Enterobacteria phage T4, complete genome |
| NC_005066 | Enterobacteria phage RB49, complete genome |
| NC_004928 | Enterobacteria phage RB69, complete genome |
| NC_005282 | Enterobacteria phage Felix 01, complete genome |
| HQ829472 | Enterobacteria phage Bp7, complete genome |
| NC_011041 | Escherichia coli bacteriophage rv5, complete sequence |
| NC_007456 | Enterobacteria phage K1F, complete genome |
| NC_001604 | Enterobacteria phage T7, complete genome |
| NC_011085 | Morganella phage MmP1, complete genome |
| HQ259105 | Escherichia phage vB_EcoP_G7C, complete genome |
| NC_008152 | Enterobacteria phage K1-5, complete genome |
| NC_007603 | Enterobacteria phage RTP, complete genome |
| GU196279 | Escherichia phage K1ind1, complete genome |
Known phage-host pairs from NCBI
755 phages with annotated hosts are analyzed for identifying the protein interaction between bacteriophage and bacteria host. Those interaction information are critical to the study of effective infection of host cells. More detail about known phage-host pairs can be seen in [26].
Output[link to result]
The results of protein interactions are shown in a data sheet with a total of 607 results, which means that proteins in 607 bacteriophages interact with proteins in their bacteria host.
- The results can be browsed in lexicographical order of the generic information
- Details of the protein interaction between bacteriophages and bacteria can be obtained by clicking the view button
- A detailed description of the meanings of the results can be refered by Help page
[1] Hannigan G D , Meisel J S , Tyldsley A S , et al. The Human Skin Double-Stranded DNA Virome: Topographical and Temporal Diversity, Genetic Enrichment, and Dynamic Associations with the Host Microbiome.[J]. Mbio, 2015, 6(5):e01578.
[2] http://psbweb05.psb.ugent.be/conet/download.php
[3] Ahlgren N A , Ren J , Lu Y Y , et al. Alignment-free $d_2^*$ oligonucleotide frequency dissimilarity measure improves prediction of hosts from metagenomically-derived viral sequences[J]. Nucleic Acids Research, 2017, 45(1):39-53.
[4] Galiez C , Siebert M , Enault F , et al. WIsH: who is the host? Predicting prokaryotic hosts from metagenomic phage contigs[J]. Bioinformatics, 2017, 33(19):3113-3114.
[5] Ye Y , Zhang Q . Characterization of CRISPR RNA transcription by exploiting stranded metatranscriptomic data[J]. RNA, 2016, 22(7):945-956.
[6] https://crisprcas.i2bc.paris-saclay.fr/CrisprCasFinder/Index
[7] Edgar R C . PILER-CR: Fast and accurate identification of CRISPR repeats[J]. BMC Bioinformatics, 2007, 8(1):18-0.
[8] Roux S , Enault F , Hurwitz B L , et al. VirSorter: mining viral signal from microbial genomic data[J]. Peerj, 2015, 3:e985.
[9] http://blast.wustl.edu/
[10] https://www.ebi.ac.uk/Tools/hmmer/search/hmmsearch
[11] Fouts, D. E . Phage_Finder: Automated identification and classification of prophage regions in complete bacterial genome sequences[J]. Nucleic Acids Research, 2006, 34(20):5839-5851.
[12] https://en.wikipedia.org/wiki/FASTA_format
[13] http://quma.cdb.riken.jp/help/fastaHelp.html
[14] http://quma.cdb.riken.jp/help/gbHelp.html
[15] Julia V , Kortine K , Vanessa J , et al. HostPhinder: A Phage Host Prediction Tool[J]. Viruses, 2016, 8(5):116-.
[16] Shapiro J W , Putonti C , Keim P . Gene Co-occurrence Networks Reflect Bacteriophage Ecology and Evolution[J]. mBio, 2018, 9(2):e01870-17.
[17] https://en.wikipedia.org/wiki/Virulence_factor
[18] https://en.wikipedia.org/wiki/Antimicrobial_resistance
[19] https://card.mcmaster.ca
[20] https://github.com/arpcard/aro
[21] Kaminski J , Gibson M K , Franzosa E A , et al. High-Specificity Targeted Functional Profiling in Microbial Communities with ShortBRED[J]. Plos Computational Biology, 2015, 11(12):e1004557.
[22] https://github.com/arpcard/rgi
[23] https://www.ebi.ac.uk/intact/
[24] Henrike Z , Katrine J , Barbara L , et al. What Can We Learn from a Metagenomic Analysis of a Georgian Bacteriophage Cocktail?[J]. Viruses, 2015, 7(12):6570-6589.
[25] Julia V , Mette L , Mogens K , et al. Metagenomic Analysis of Therapeutic PYO Phage Cocktails from 1997 to 2014[J]. Viruses, 2017, 9(11):328-.
[26] Shapiro J W , Putonti C , Keim P . Gene Co-occurrence Networks Reflect Bacteriophage Ecology and Evolution[J]. mBio, 2018, 9(2):e01870-17.
[27] https://www.hmpdacc.org/hmp/
[28] Ester,M., Kriegel,H.P., Sander,J. and Xu,X. (1996) A density-based algorithm for discovering clusters in large spatial databases with noise. KDD-1996 Proceedings. AAAI Press, Menlo Park, CA, pp. 226–231.
[29] You Zhou, Yongjie Liang, Karlene H. Lynch, Jonathan J. Dennis, David S. Wishart (2010) "PHAST: A Fast Phage Search Tool" (Nucleic Acid Research submitted)
[29] Bland C, Ramsey TL, Sabree F, Lowe M, Brown K, Kyrpides NC, Hugenholtz P. CRISPR Recognition Tool (CRT): a tool for automatic detection of clustered regularly interspaced palindromic repeats. BMC Bioinformatics. 2007 Jun 18;8(1):209